2024 Market Outlook for Global Stock
on June 18, 2024
with No Comments
We agree with Kleintop’s assessment that valuations suggest that international equities are poised for more gains.
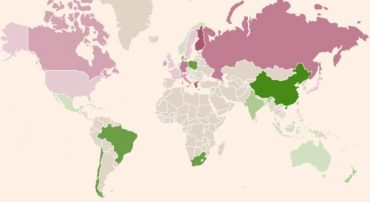
Every year the Heritage Foundation evaluates all the world’s countries using their Index of Economic Freedom, where a high score correlates to nearly every positive measure of a country. We then use this analysis to craft our Foreign Stock investment strategy that we call “Freedom Investing.”

We agree with Kleintop’s assessment that valuations suggest that international equities are poised for more gains.

This quarter, we saw that in 1-year returns ending March 31, 2024, Developed Freedom Investing had a -5.8% disadvantage, Emerging Market Freedom Investing had a +3.83% advantage, and Overall Freedom Investing had a -2.89% disadvantage.

Last year, eleven countries made our cut-off. This year, twelve do.

Because of Mexico’s current valuation, we believe that it has the possibility to perform well regardless of how this potential conflict resolves.

This quarter, we saw that in 1-year returns ending December 31, 2023, Developed Freedom Investing had a -3.97% disadvantage, Emerging Market Freedom Investing had a +4.9% advantage, and Overall Freedom Investing had a -1.27% disadvantage.

This quarter, we saw that in 1-year returns ending September 30, 2023, Developed Freedom Investing had a -4.77% disadvantage, Emerging Market Freedom Investing had a +3.89% advantage, and Overall Freedom Investing had a -1.63% disadvantage.

If China booms, it may be a mistake that we reduced the allocation. If China undergoes investment controls, it may be a mistake that we kept China at all.

This article is a curated list of recent news about Taiwan.

This quarter, we saw that in 1-year returns ending June 30, 2023, Developed Freedom Investing had a -3.68% disadvantage, Emerging Market Freedom Investing had a +4.15% advantage, and Overall Freedom Investing had a -0.61% disadvantage.

This quarter, we saw that in 1-year returns ending April 30, 2023, Developed Freedom Investing had a -2.99% disadvantage, Emerging Market Freedom Investing had a +1.85% advantage, and Overall Freedom Investing had a -0.4% disadvantage.

Last year, thirteen countries made our cut-off. This year, eleven do.

Reducing expense ratios by a theoretical 0.42% is a significant result. It is good to know that what works in theory has also worked even better in practice.

Here is a review of the performance of Freedom Investing in 2022.

This quarter, we saw that in 1-year returns ending December 31, 2022, Developed Freedom Investing had a +0.13% advantage, Emerging Market Freedom Investing had a +0.45% advantage, and Overall Freedom Investing had a +0.77% advantage.

This quarter, we saw that in 1-year returns ending September 30, 2022, Developed Freedom Investing had a -0.44% disadvantage, Emerging Market Freedom Investing had a -0.34% disadvantage, and Overall Freedom Investing had a +0.14% advantage.

This quarter, we saw that in 1-year returns ending June 30, 2022, Developed Freedom Investing had a -1.19% disadvantage, Emerging Market Freedom Investing had a +0.46% advantage, and Overall Freedom Investing had a -0.12% disadvantage.

FRDM is interesting, but using our country specific funds plus a low cost Vanguard Emerging Market fund allows us to emphasize freedom for as low a cost as possible.

This quarter, we saw that in 1-year returns ending March 31, 2022, Developed Freedom Investing had a +1.44% advantage, Emerging Market Freedom Investing had a +2.07% advantage, and Overall Freedom Investing had a +1.28% advantage.

We are constantly reviewing our portfolios’ asset allocations in order to bring them more in line with our Investment Committee’s best practices. Here is a summary of our recent changes.

This year, we decided to analyze the predictive power of these sub-scores on overall future investment returns.

At 4.0% inflation, cash will lose 82.88% of its value over 45 years. Such loss of value can ruin a retirement plan more so than any market returns. Your long term investments need to appreciate well over inflation. The best method to do that is to stay mostly invested in stocks.

At the start of the year, purchases of all of these securities had no transaction fee at Charles Schwab. However in December 2021, Schwab added a transaction fee to some of the holdings.

The estimated advantage of Franklin funds during 2021 was 0.40% or $118,955.

An initial equal weight strategy of these 26 companies implemented on January 1, 2021 and held without further buys or sells through December 31, 2021 had a +8.64% advantage over the foreign healthcare benchmark.

This quarter, we saw that in 1-year returns ending December 31, 2021, Developed Freedom Investing had a -0.12% disadvantage, Emerging Market Freedom Investing had a +1.27% advantage, and Overall Freedom Investing had a +0.21% advantage.

On Friday, November 5, 2021, Megan Russell was interviewed by Michael Morton of Financial Planning for Entrepreneurs podcast to discuss Freedom Investing.

This quarter, we saw that in 1-year returns ending September 30, 2021, Developed Freedom Investing had a +0.70% advantage, Emerging Market Freedom Investing had a +1.64% advantage, and Overall Freedom Investing had a +0.71% advantage.

This article is part of my series where I review how Freedom Investing performs for the quarter.

Home bias is the tendency of investors to invest a majority of their assets in companies domiciled in their home country. Recency bias is the tendency for humans to believe that what has happened recently will continue to happen in the future.

While many have been following the domestic returns and recovery, fewer investors know how well foreign investments did this past year.

This means that in addition to the overall Emerging Market funds, we will have country-specific Emerging Market allocations to both Taiwan and Chile.

No one knows what the future holds for Hong Kong, but we needed to make a decision on whether it has a place in our Freedom Investing.

We believe these 26 companies will be an effective weight to add foreign healthcare to our portfolios.

In this article, I am reviewing the quantitative measurements and performance metrics of Freedom Investing to see how its risk and return compare to the EAFE Index, its benchmark.

Hong Kong has always been an anomaly: a tiny, extremely free country with an expiration date in 2047.

As a result of new fund additions, we added five new country-specific funds to our Schwab Institutional Intelligent Portfolio asset allocations.

These findings together demonstrate how Economic Freedom seems to have been a valid factor for higher expected returns than investing in the EAFE Index alone.

An analysis of changing to lower cost funds.
There are as many as 60 different stock markets around the world.

In 2003, the Goldman Sachs Global Economics Department predicted the economic and geopolitical influence of Brazil, Russia, India and China (the BRIC countries) would become increasingly visible in the developed world. We revisit those countries here.

The bonus in returns of countries with freedom over and above the MSCI EAFE foreign index ranges from 1.28% to 1.91%.
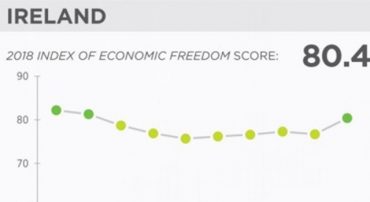
In recognition of its efforts to reduce its debt and deficit and Ireland’s return to the “free” category of the economic freedom index, I think the letter I for Ireland should be removed from PIIGS and it should return once more to just PIGS.

Under weighting Canada could have the effect of diminishing your returns. If your fund under weights Canada, consider switching to a lower cost fund which properly represents it.

In 2016, the average return of the best investment products of the Freedom Six outperformed the Vanguard FTSE Developed Markets ETF by 6.75%.

The future may be uncertain, but the markets are quite reliable in the long run.
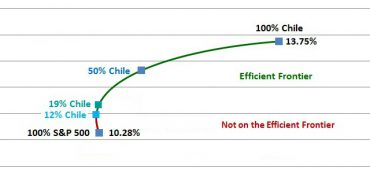
Adding a little bit of Chile to your portfolio can boost returns and reduce volatility.

That is a tremendous advantage for businesses in states with less regulatory burden.

Should we have a “Free Countries Asset Class” or a “Foreign Stock Asset Class?”

“We still have plenty of problems, but we’re much better than France, Britain and Germany.”

At first glance, AUNZ did not have great returns in 2014. But is that the whole story?