 Our Investment Committee is responsible for developing and reviewing our Asset Allocation design methodology, selecting and defining our asset classes, selecting and defining our sectors, determining the correct weight and dynamic tilt for each sector, selecting which specific securities are on our Buy List, and reviewing overall performance of client accounts on a quarterly basis to assess for any strategic changes.
We call the specific set of securities we purchase to implement our strategy our “Buy List.” We call it this because it is what we would ideally purchase if a client came to us all in cash. We regularly review our Buy List as we are always looking for even better securities to implement our investment strategy.
Recently, we have paid particular attention to our Freedom Investing funds because it is hard to find inexpensive country-specific funds.
That attention paid off as earlier this year we found two country-specific funds with lower expense ratios than our previous selections. These are our Buy List options for Australia and Switzerland.
Our old selections were iShares MSCI Australia ETF (EWA) and iShares MSCI Switzerland ETF (EWL). Each had an expense ratio of 0.47%.
Our new selection is Franklin FTSE Australia ETF (FLAU) and Franklin FTSE Switzerland ETF (FLSW). Each has an expense ratio of 0.09%.
This expense ratio difference is the largest difference between the two funds. If it was the only difference, we would expect the switch to Frankiln funds to save our clients 0.38% annually. This is the biggest motivator for making the switch.
There are also a few subtle differences between the old funds and the new funds.
Inception Date
First, the new Franklin funds, FLAU and FLSW, have inceptions dates of 11/2/2017 and 2/6/2018 respectively where as the iShares Funds, EWA and EWL, have inception dates of 03/12/1996. This means that the Franklin funds’ track records are relatively short.
Despite this limitation in analyzing the funds, they provide historical data for the FTSE index that the funds are based upon back to June 2000. Which brings us to the second difference.
Index Selection
While both the iShares and the Franklin funds are index funds, they use two difference indexes. The iShares funds use the MSCI Australia and MSCI Switzerland. Meanwhile, the Franklin funds uses FTSE Australia and FTSE Switzerland.
These funds span the style boxes as follows: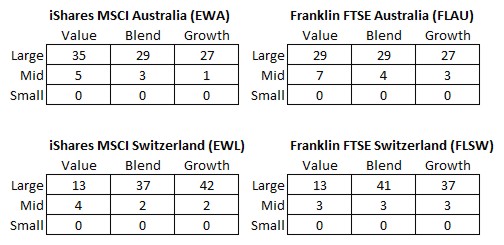
Although small-cap value has the highest expected return, it also has the highest expected volatility. Mid-cap value has a better risk adjusted return, and an allocation to large-cap stocks can help mute the already inherently volatile markets.
As you can see, both Franklin funds have more allocated to mid-cap than the iShares Funds. This might make them more volatile but also have a higher return.
The Franklin funds also tilt a little more toward Large Blend compared to the iShares Fund’s tilt towards Large Value. We tend to use a dynamic asset allocation to decide whether to highlight Growth or Value and believe the optimum mix may vary depending on market conditions.
Both of these style box differences will, at times, effect returns.
Regardless of this stylistic change, we believe the Franklin fund is a better choice. The Franklin fund has a 0.38% lower expense ratio (0.47% – 0.09%). Because of this immediate and guaranteed savings in expense ratio, we believe that the Franklin funds will produce a higher return.
| Here are the returns of the two Australian indexes for various years:
|
Here are the returns of the two Switzerland indexes for various years:
|
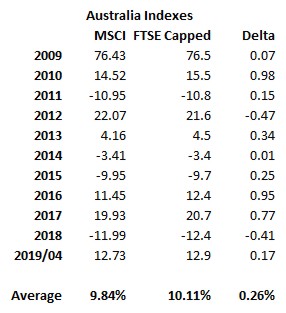
You can see that the difference in average returns is less than the 0.38% expense ratio difference, meaning the lower expense ratio is likely going to generate higher returns regardless of the funds performance differences.
Number of Holdings
Another difference is the size of holdings. As we discuss in “What Is The Relationship Between Number Of Holdings and Returns?,” there is no such thing as over-diversification. More holdings normally means better returns as your investment is diversified across more companies.
Here is how the two funds compare:
| iShares Fund | Franklin Fund | |
|---|---|---|
| Australia | 75 | 100 |
| Switzerland | 46 | 51 |
The top 10 holdings for each fund family are identical, although their percentages are slightly different. In this way, we view these two indexes and funds as roughly identical, although their month-to-month returns may vary significantly.
The average difference between Australia’s monthly returns was 0.94% and Switzerland’s was 1.31%. That is a significant monthly difference for two indexes that track the same country with roughly the same number of stocks.
Because of the larger number of holdings, we would expect the Franklin funds to perform better in normal markets when mid-cap performs better while iShare might perform better in down markets.
Comparing the two indexes is part of vetting that we are safe to switch to the lower cost fund and not suffer under an inferior index. In this case, we believe the FTSE Index will have a higher return, but not in down markets such as 2018.
For Australia so far in the brief 17 months both funds have been running between 11/30/2017 and 4/20/2019, EWA has averaged 2.73% and FLAU 2.92%.
For Switzerland so far in the brief 14 months both funds have been running between 2/28/2018 and 4/20/2019, EWL has averaged 5.12% and FLSW 3.61%.
Both FTSE Capped Indexes suffered slightly during 2018 as expected. Having more stocks means that the FTSE index includes more of the more volatile mid-cap stocks, which can pull down years down farther. The same effect can happen in reverse during up years.
Expected Savings For Clients
Some of our client’s investments in EWA and EWL may be held in taxable accounts. In those accounts, these two positions may be highly appreciated. Selling them to purchase FLAU and FLSW would require realizing the capital gains and paying the capital gains tax.
Internally, we have developed what we call Hurdle Table Formulas to determine how much greater expected return justifies selling appreciated positions. This formula is incredibly complex.
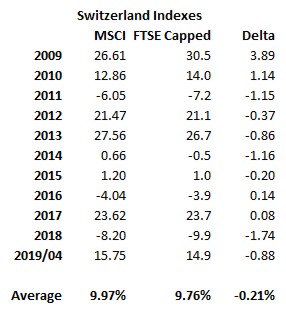
We have this formula programmed into our analysis, so we can quickly assess positions and make recommendations to clients. As an example, here is a portfolio that holds four different trade lots of EWL. Each trade lot was purchased at different times for different amounts. Each therefore has a unique cost basis and a unique unrealized capital gain. If a position were sold, that capital gains would need to be paid. If the capital gains tax for this client were 20.75% (15% federal and 5.75% Virginia state) and you wanted to know the extra return you would have to make to break even over the next 10 years, we can use these programmed formulas to compute the required return.
We call the necessary return the “Hurdle Return.” Here is an analysis for this example’s four EWL trade lots:
Since we expect to reduce the expense ratio by 0.38%, we could justify selling the last two trade lots and paying the capital gains tax. Their Hurdle Returns of 0.25% and 0.15% are less than the 0.38% extra we expect to earn each year. The first two positions, on the other hand, have much higher hurdle returns. The breakeven point for selling these trade lots and purchasing FLSW is longer than 10 years.
For each client the conditions of the analysis may be different. One client may be in California and subject to very high state capital gains tax. Another may be in Florida with no state income tax. One client may expect to sell the position in five years. While another client may never expect to sell the position. They may expect to leave the position in their estate, receive a step up in cost basis, and avoid capital gains taxes entirely.
Each of these parameters are part of the inputs to our Hurdle Rate calculations. Having this math programmed on our back office computer systems help us make complex decisions and recommendations more quickly and accurately.
For this client, selling the last two EWL positions will generate $39,097.92 in cash and $7,287.84 of capital gains resulting in $1,512.23 of capital gains tax owed. Reinvesting the cash in FLSW with a 0.38% lower expense ratio could generate an extra $148.57 in return each year. Over the next ten years that extra return should compound to more than compensate for the capital gains tax owed. Our analysis suggests that investors could be less hesitant to sell high cost funds, even if they have to pay something in capital gains, so that they can move their wealth into lower cost investment vehicles.
In taxable accounts, the decision to replace these funds is complex because of the capital gains calculation. Traditional or Roth IRA accounts are not subject to capital gains taxes and therefore it is a good idea to switch funds when an equivalent fund has a lower expense ratio. Those changes are gradually being made in our client accounts over the next few months.
This example may seem like a small amount of gain to be worried about. But small changes over long periods of time produce large effects.
Collectively, we had about $15.2 million invested in EWA and EWL. If we were able to switch all of that investment into FLAU and FLSW our clients would save (or earn) an extra 0.38% on that amount of money. This would result in a collective $57,684 for our clients each year. We believe that is a significant savings for the time and effort required to make the switch.
Although changes to the Marotta Buy List happen infrequently, monitoring and adjusting that list can produce a significant effect in client accounts. Simply comparing the fund families promoted on the Ameriprise platform with the fund families used in the portfolios built here at Marotta shows the difference.
Assuming Ameriprise builds portfolios with an average expense ratio of 0.79%, our portfolios, with an average expense ratio of 0.24%, produce 0.55% savings for clients right there.
As of the end of 2018, we had over $365 million under discretionary management. By saving 0.55% on unnecessary fund fees, we may have saved our clients over $2 million each year.
Photo by Tim Trad on Unsplash
Latest posts from David John Marotta
- How To Distribute from A College America 529 Plan to an Account Owner - October 22, 2024
- #TBT Are Democrats Or Republicans Better For The Stock Market? - October 17, 2024
- How To Distribute from A College America 529 Plan to a Designated Beneficiary - October 15, 2024
Latest posts from Megan Russell
- #TBT Don’t Increase Your Bond Allocation In Bear Markets - October 24, 2024
- How To Distribute from A College America 529 Plan to an Account Owner - October 22, 2024
- How To Distribute from A College America 529 Plan to a Designated Beneficiary - October 15, 2024