 Portfolio design and rebalancing is both a science and an art. Understanding the science is akin to understanding the physics of why a spinning ball hooks and bends. The art is the execution of the science such as when you are actually playing soccer or golf. It is the execution and follow-through that produces the desired outcome.
As we wrote in “The Art and Science of a Bond Allocation“:
Taking money out of stocks when stocks are down is harmful to the plan whether you do it seven years in advance for a bond allocation or right before you spend it.
This is where the artistry of asset allocation comes in.
We call this an art because testing the wisdom of when to move more conservative is difficult. The situation depends heavily on the age of the investor and the time period or sequence of the returns. Each finding will be specific to that analysis and is difficult to generalize. However, together all the data points can tell a narrative and suggest a strategy.
To test the artistry, I ran a historical analysis on asset allocation changes. I used the total return of the Bloomberg Aggregate Bond Treasury Index for Stability and the price return of the S&P 500 Index for Appreciation. These two indexes were selected because of their long running historical data of January 1, 1976 through September 30, 2023.
For this analysis, I used our default age-appropriate safe withdrawal rates to simulate investor spending and used an ideal bond allocation sufficient for 7-years of this spending rate (6.42 times the annual safe withdrawal rate). Each year, I calculated a new monthly safe withdrawal rate for the next 12-months on my hypothetical investor’s birthday, which I set as the first day of the first month of the relevant time period.
Then, I tested three different asset allocation update strategies.
- The adjusted portfolio updated the investor’s asset allocation on their birthday at the same time as their safe spending rate without any concern for what is happening in the market.
- The rules-based portfolio evaluated the current performance of the stock market and only updated the investor’s asset allocation if the Appreciation Index was not in a Bear Market. A Bear Market for the Appreciation Index was defined as having been down more than 20% since its last high without setting a new high yet.
- The never changing portfolio set the asset allocation once at the beginning and never updated it again.
These portfolios can be compared on how much more or less wealth the portfolio has at the end. However, they can also be compared by how much richer or poorer the spending journey is along the way. This is because to simulate real life, each of these portfolio’s withdrawals are slightly different. More investment returns for one portfolio creates a higher account balance which then fixes a higher safe withdrawal rate for that portfolio in the new year.
All of the percentages of both the rules-based portfolio and the never changing portfolio are measured against the adjusted portfolio’s numbers.
Too much stock often returns more but is risky.
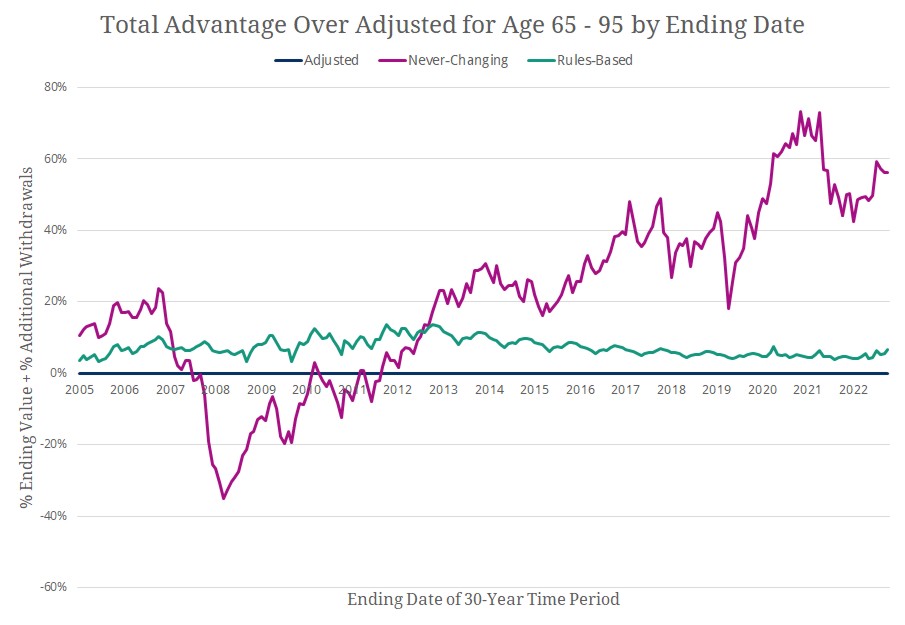
Using an investor who starts at age 65 and withdraws until the end of age 95, there are 213 available rolling 30-year time periods between January 1976 and September 2023. Of those, 147 of them or 69.01% are richest under the never changing portfolio. The remaining 66 periods or 30.99% are the reason we recommend a bond allocation.
In most historical time periods, the portfolio with more stocks has the most money at the end and spends the most along the journey. This is in keeping with the results that we found in “Your Asset Allocation Should Be Priceless.” While all stock portfolios can run out of money when subjected to withdrawals, many historical time periods do not have this problem.
The age 65 asset allocation is 27.98% Stability (bonds) and 72.02% Appreciation (stocks), so this is where the never changing portfolio fixes itself.
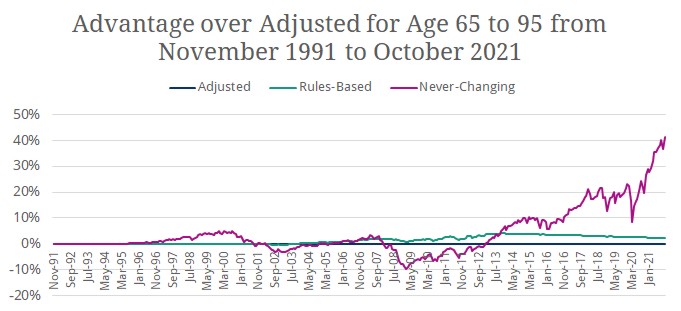
In my analysis, the never-changing portfolio’s best time period is November 1991 through October 2021.
During this time period, the stock index posted an 8.55% annual return while the bond index only posted a 3.99% annual return. In the end, the never changing portfolio was 68.61% richer than the adjusted portfolio. Furthermore, the never changing portfolio was able to withdraw 4.73% more throughout the journey. This time period features the The No-Bear Bull Market of the 1990s as well as the strong recovery out of The 2008 Crash.
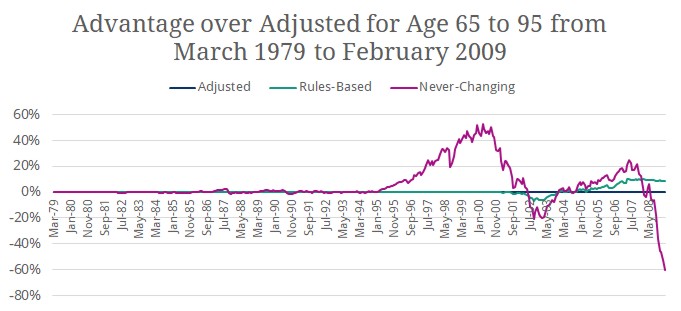
The worst time period for the never changing portfolio is March 1979 through February 2009.
During this time period, the stock index posted a 7.01% annual return while the bond index posted the higher 7.88% annual return. The never changing portfolio was -38.31% poorer than the adjusted portfolio at the end of the plan but was able to withdraw 3.21% more throughout the journey. This time period has both The Dot Com Bubble Bear Market of 2001 and The 2008 Crash late in its spending journey.
While the safe withdrawal rates manage to ensure that our theoretical investor does not run out of money, they are impoverished due to their overly risky asset allocation.
Stable artistry pays off.
 While the never changing portfolio was better than the adjusted portfolio 78.40% of the time, the rules-based portfolio was better than the adjusted portfolio in 100% of the time periods.
By increasing its bond allocation only when the markets are not in a bear market, the rules-based portfolio is able to capture more of the stock market recovery.
The time periods where the adjusted portfolio outperformed the never changing portfolio are those that start in or after February 1978 and end in or before June 2013.
The best time period for the rules-based portfolio is October 1982 through September 2012 where the portfolio is 12.64% richer than the adjusted portfolio at the end of the plan and was able to withdraw 1.04% more throughout the journey. During this time period, the rules-based portfolio holds the asset allocation static in 1987 to 1989 (Black Monday Bear: The Bear Market of 1987), 2001 to 2007 (The Dot Com Bubble Bear Market of 2001), and 2008 to 2013 (The 2008 Crash). During the same time period, the never-changing portfolio was only 5.63% richer and spent 0.14% more.
The worst time period for the rules-based portfolio is September 1980 through August 2010 where the portfolio is 2.34% richer than the adjusted portfolio at the end of the plan and was able to withdraw 0.88% more throughout the journey. During this time period, the rules-based portfolio holds the asset allocation static in 1982 (Volker’s Bear: The Bear Market of 1982), 1988 (Black Monday Bear: The Bear Market of 1987), 2001 to 2007 (The Dot Com Bubble Bear Market of 2001), and 2008 to 2013 (The 2008 Crash). During the same time period, the never-changing portfolio was -21.02% poorer and spent 1.50% more.
Averaging the time periods shows that on average the rules-based portfolio is 6.17% richer than the adjusted portfolio at the end and is able to spend 1.13% more throughout the journey.
Discipline beats emotion.
In each bear market, panicked investors are tempted to flee to the presumed safety of bonds and cash. However, we can see from this analysis that successful investors remain calm and firmly hold the course.
History suggests that the path to wealth and security is rebalancing your current asset allocation while you await the recovery.
There is an artistry to a bond allocation, and while historical analysis can only be suggestive, it does tell a strong narrative that you should not move more conservative during down markets.
Photo by Steven Cordes on Unsplash. Image has been cropped. Returns data gathered from Morningstar Advisor Workstation.

