 A Bear Market is defined as an index dropping at least 20% from some previous high. Smaller drops in the market between 10% and 20% are called “corrections” while larger drops of at least 50% are called “crashes.”
Prior to this week and since 1950, there had been exactly nine Bear Markets in the S&P 500 Price Index (the most common representation of “the market”). Only one of these turned into a stock market crash. The other eight stopped dropping before the loss from peak to bottom was greater than 50%.
Although you might think that only nine Bear Markets over 65 years makes its occurrence uncommon, each bear market lasts about 3.3 years from peak to bottom and back to full recovery. In fact, the S&P 500 spends 18.19% of the time with losses of 20% or greater from some previous high. That means that, on average, 66 days of each year the S&P 500 Price index is down more than 20% from some previous high.
Examining past Bear Markets can help provide some context when we experience the next one.
The Dot Com Bubble: The Bear Market of 2001
The market as measured by the S&P 500 Price Index reached a new high of 1,527.46 on March 24, 2000. Just 22 days earlier, my father, George Marotta, gave a speech entitled, “Dow 36,000 or 6,000?” in which he suggested:
The market is very “pricey” when old-fashioned measures of stock market valuation are examined. There are other disturbing signs that may point to a “top” in this market. …
The Dow average now stands at about the 10,000 level. … If the Dow were trading at valuations that prevailed from 1926 through 1994, it would now be at about the 6,000 level.
In fact, when the Dow finally bottomed it was at 7,286.27.
George Marotta’s insight was not precognition. It was simply an observation of human nature that when people chase returns and buy what appears to be “going up” it creates a bubble that is unsustainable. His advice was not a doomsday message that investors should get out of the markets to avoid a coming crash. It was a recommendation to have a balanced portfolio that includes many different asset classes including small and mid-cap stocks and international stocks from a vast global market.
What dropped during 2000 through 2002 was what had gone up the most during the Bull Market of the 1990s, large cap growth technology stocks. Investors had piled more and more money into “the best” mutual funds as measured by Morningstar.
During the 1990s, Morningstar’s star ranking system was so broad that all U.S. stock funds were compared against each other. In 2000, funds that received 5 Morningstar stars were primarily large cap growth technology funds. As a result, that year the number of Morningstar stars inversely predicted a fund’s likely return. It wasn’t until July of 2002 that Morningstar finally broke Domestic-stock funds into different categories . But even the current breakdown of Morningstar’s categories continue to evaluate some funds in categories which are too broad.
In March of 2000, Cisco’s market cap surpassed Microsoft’s and Cisco became the largest company in the United States. Any mutual fund that did not have a significant portion of their investments in Cisco had inferior historical returns and likely did not receive a 5-star rating. Some investors using Morningstar’s rating system had multiple 5-star mutual funds all of which consisted primarily of large cap growth technology funds and the number one holding in each of them was Cisco Systems (CSCO). Such investors thought they were diversified, but had 30% or more of their portfolio in one individual stock. This concentration in a single stock or sector of the economy is one of the dangers of picking funds based on their past performance or some arbitrary rating rather than understanding a fund’s underlying components or strategy. Funds picked on the basis of recent past performance will often be those categories which move in sync with one another. It is better to build a portfolio from desired components based on very long-term characteristics and then find the investment choices that best represent them.
From the high of the market, the market dipped for 21 days ending down -11.19% into a correction only to bounce immediately back as investors put more money into the markets. It dipped again into correction territory on May 23, 2000, down -10.06% from the all-time high only to bounce again immediately back as investors bought on the dip.
The admonition to “Buy on the dips” is a trading strategy that suggests that when a stock or the market drops in value it is a good time to buy. Buying after the markets have gone down may take courage and conviction, but is not a bad idea. The natural process of rebalancing buys what has dipped. But rebalancing also sells what has gone up. During the 1990s investors were not rebalancing their portfolio. They were using dips as an excuse to pile more and more money into a single strategy without balancing their overall portfolio.
By July 17, 2000, the market had risen back within 1.11% of its all-time high only to dip and then rise again reaching within 0.44% of its all-time high on September 1, 2000. During 2000, much of the U.S. market continued to appreciate. During that year large cap value would appreciate 5.66%, mid-cap value 24.59%, and small cap value 18.65%. Meanwhile, technology stocks were dropping.
Cisco peaked on March 27, 2000 at a price of $80.0625. By the end of the year it would be down -52.22%.
Meanwhile, it was October 11, 2000 when the market entered another correction gradually see-sawing lower for the next 152 days until on March 12, 2001 the S&P 500 Price Index had dropped to 1,180.16, down -22.74% into a Bear Market. By then Cisco had lost 76.50% of its value.
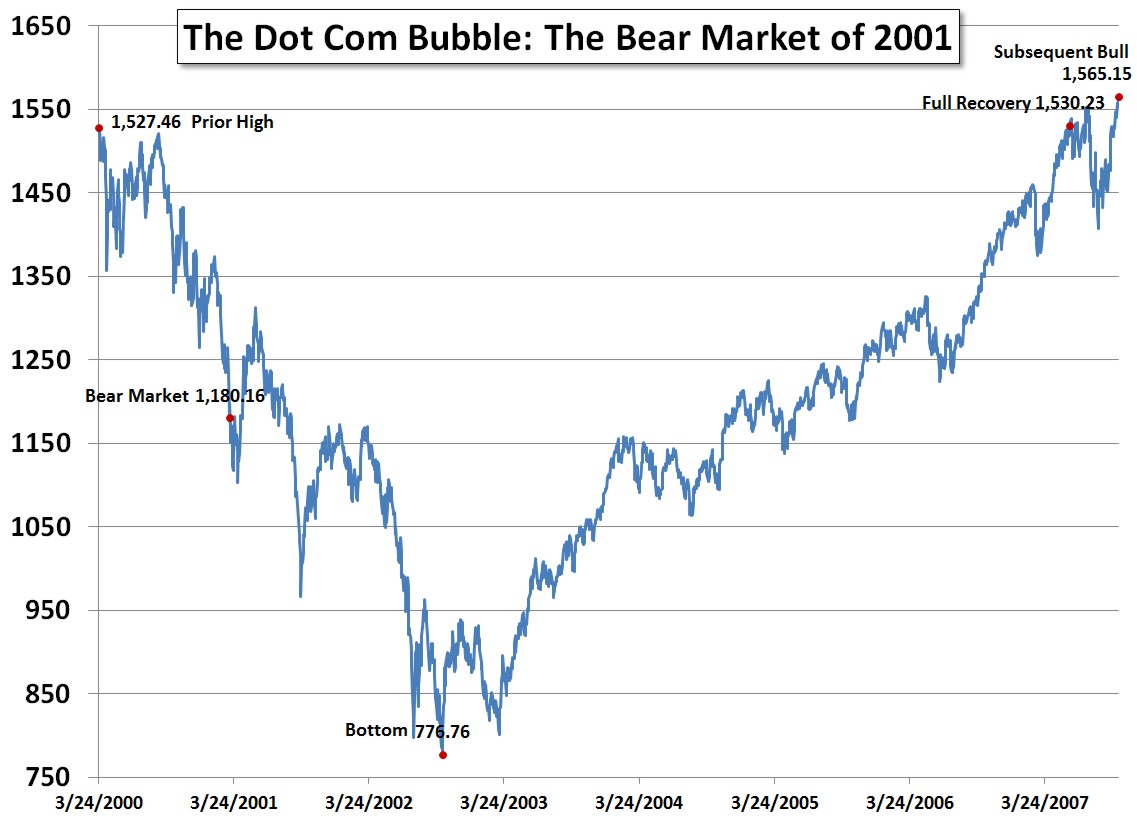
By the time the market entered a Bear Market, it had been dropping and recovering for 353 days (11.8 months).
Over the next 1,703 days (4.7 years), the S&P 500 Price Index dropped even deeper, especially after the September 11th attacks by al-Qaeda.
Although 2000 through 2002 were terrible years for investment returns, the amount lost by investors was directly related to their lack of diversification. Investors who were concentrated in U.S. large cap growth technology funds suffered the worst.
As the market recovered, it rose and then dropped below the -20% mark 10 additional times.
Any diversification from large cap growth helped limit losses during the Dot Com Bubble, and helped recover more quickly after the market bottomed. Here are the U.S. Stock returns each calendar year as defined by Morningstar’s style boxes:
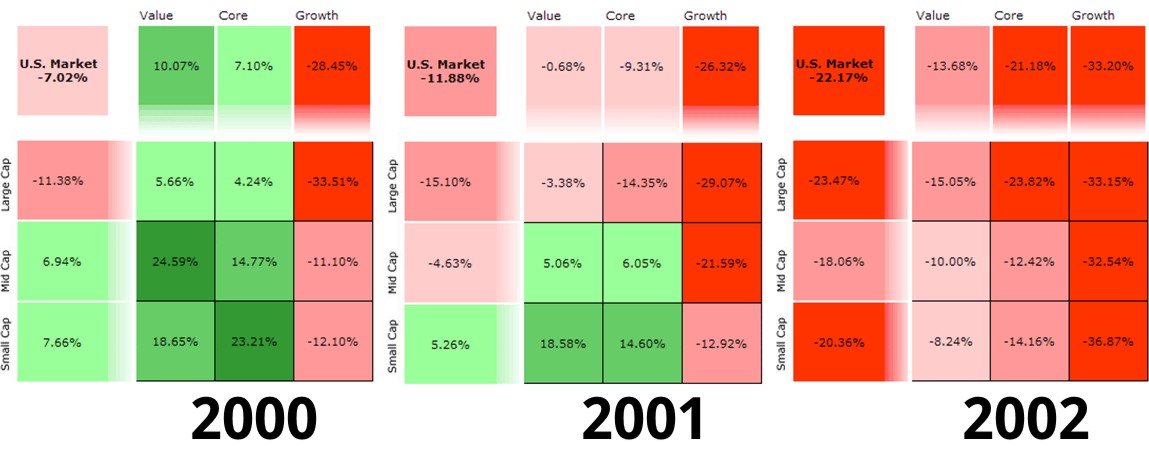
During 2000 the losses were confined to growth and concentrated in large cap technology stocks. Meanwhile, small cap value had a positive 18.65% return. During 2001 losses expanded from growth to encompass the entire large cap sector, but small cap value still experienced a positive 18.58% return. It wasn’t until 2002 that all style boxes experienced negative returns, but even then small cap value’s losses were limited to -8.24%.
Over the three-year period, large cap growth lost -68.47% of its value while small cap value appreciated 29.10%.
The market bottomed 576 days after becoming a Bear Market on October 9, 2002, down -49.15% from it prior peak. Just two days later I wrote the article, “Strategies for Today’s (Fall, 2002) Stock Market Investing: Why Your Portfolio May Not Be Ready” about the need to hold a diversified portfolio and the foolishness of failing to be invested. I wrote:
Many investors have given up on the stock market. Record amounts of money have recently been taken out of stocks and put into bonds. These investors assume that at least their money will be safer in cash or bonds. These assumptions are wrong. …
Investors should keep at least half of their assets outside the US dollar. This means investing in foreign bonds, foreign stocks, and hard asset stocks. Hard asset stocks hold their value during inflation because they own tangible resources such as oil and precious metals.
Again, my insight was not precognition. It was simply an observation of human nature that when people flee a Bear Market and sell what appears to be “going down” it creates a drop that is unsustainable. My advice was not a get rich quick message. It was a recommendation to have a balanced portfolio that includes many different asset classes. It was just as good advice at the top of the market as it was at the bottom.
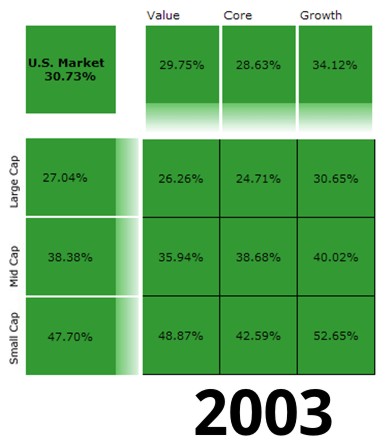
And it proved to be excellent advice going forward. Here are the U.S. Stock returns for 2003 as defined by Morningstar’s style boxes:
After bottoming, the market fully recovered its prior peak just 1,694 days (4.6 years) later on 5/30/2007. The entire cycle lasted 2,623 days (7.2 years), 929 days from prior peak to the bottom and 1,694 days back to the prior peak. After recovery the market continued its upward trend for an additional 4 months (4.4 months). The total 61-month (5.0 years) bull market ultimately peaked on 10/9/2007 at 1,565.15, up 101.50% from the bottom of the bear market. During the total recovery from the bottom, the markets experienced an annualized return of 15.04%.
Lessons from the Dot Com Bubble
Bear Markets can be frightening and traumatic experiences. As a result, investors can learn the wrong lessons.
They try to keep their money safe but then they lose consistently to inflation. They seek a “guarantee” and lose to fraudulent sales pitches. They try to educate themselves and fall prey to sponsored content or useless articles. They seek a professional advisor and end up hiring a commission-based sales person.
If you do it yourself, craft a balanced portfolio of things that on average go up and don’t fret the short-term volatility. If you seek investment advice, find a fee-only fiduciary who offers personal, integrated financial planning.
This Bear Market serves as a reminder that many popular investment analysis strategies such as Morningstar stars appear useful looking backward while not actually being useful going forward. After the strategy is debunked, it is modified until it again appears useful looking backward. Investors should not build their investment strategy on anything less than actual factors such as value that help determine returns over very long periods of data.
Attempts to time the market failed miserably. Some investment pundits regularly predicted the Dot Com Bubble years before it happened. Those who predicted it every couple of months could ultimately claim that they were right, but caused many investors to lose years worth of Bull Market growth.
Diversification is important. Diversification did not eliminate losses, but it did lose less and recover more quickly. We believe that these are just as important as gains when the markets are appreciating.
Photo by Thomas Bonometti on Unsplash
Latest posts from David John Marotta
- #TBT A Review of Finances at Age 60 - July 25, 2024
- #TBT Implement the Automatic Millionaire at Schwab - July 18, 2024
- #TBT Stress Is Not Your Enemy - June 27, 2024