 A Bear Market is defined as an index dropping at least 20% from some previous high. Smaller drops in the market between 10% and 20% are called “corrections.” Larger drops of at least 50% are called a “crash.”
Since 1950, there have been exactly nine Bear Markets in the S&P 500 Price Index (the most common representation of “the market”). Only one of these turned into a stock market crash. The other eight stopped dropping before the loss from peak to bottom was greater than 50%.
Although you might think that only eight Bear Markets over 65 years makes its occurrence uncommon, each bear market lasts about 3.3 years from peak to bottom and back to full recovery. In fact, the S&P 500 spends 18.19% of the time with losses of 20% or greater from some previous high. That means that, on average, 66 days of each year the S&P 500 Price index is down more than 20% from some previous high.
Examining past Bear Markets can help provide some context when we experience the next one.
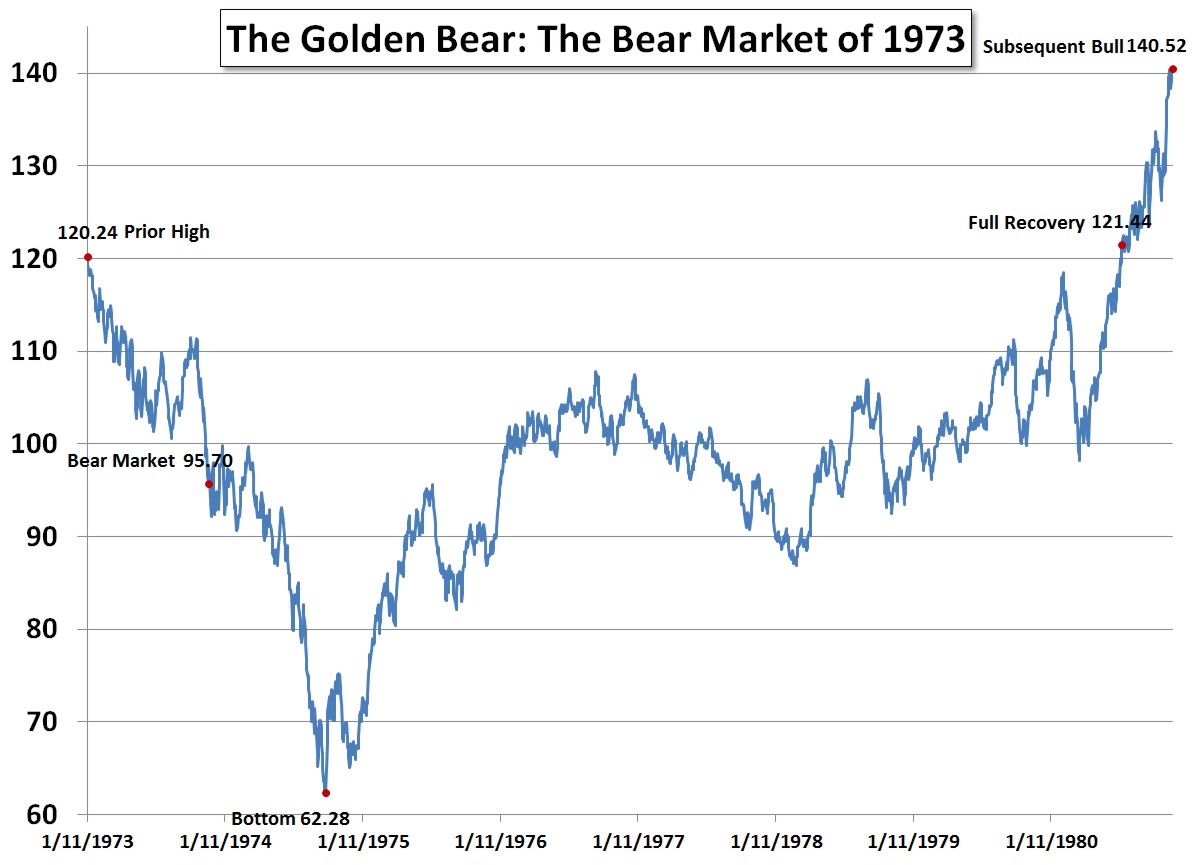
The Golden Bear: The Bear Market of 1973
On 11/27/1973 the S&P 500 Price Index dropped to 95.70, down -20.41% from its prior high on 1/11/1973.
The market had been dropping for 320 days (10.7 months) erasing the 10.4 month bull market after the Double Bottom Bear Market of 1970.
It bottomed 310 days later on 10/3/1974 at 62.28, down -48.20%. This bottom dipped below both of the prior bottoms of the Double Bottom Bear. It even dipped below the bottom of the Baby Bear Market of 1966. Given the lack of a sustained recovery from the previous two Bear markets, the 14 year period from 2/9/1966 through 3/27/1980 is considered one of the greatest challenges to retirement planning. Those retiring in early 1966 faced 14 years of high inflation and poor stock market returns. Those who continued working received wage increases which helped compensate for high inflation, while those who were retired had to increase their withdrawals in order to keep up with inflation.
Because of the prolonged poor returns of this time period, it is common for retirement software to stress test a retirement plan to see if a given standard of retirement lifestyle is sustainable using market returns beginning in 1966.
Nixon’s abandonment of the gold standards of the Bretton Woods system in 1971 is often credited as the cause of what was a global drop in stock prices in 1973 giving this Bear market its name: The Golden Bear. In addition to the devaluation of the dollar, the OPEC oil embargo caused oil prices to rise sharply resulting in oil shortages across the United States. Like all time periods, 1973 through 1980 was filled with troublesome news headlines. But it was also filled with economic policies which, although well intentioned, hindered rather than helped.
Over the next 1918 days (5.3 years) the S&P 500 Price Index rose and then dropped below the -20% mark 24 additional times. This prolonged Bear market was the worst Bear Market that the S&P 500 has experienced to date.
After bottoming on 10/3/1974, the market fully recovered its prior peak 2114 days (5.8 years) later on 7/17/1980.
The entire cycle lasted 2744 days (7.5 years), 630 days from prior peak to the bottom and 2114 days back to the prior peak. Although the length of this cycle (7.5 years) is longer than average, it provides a measurement of how long you might need to give stocks before they recover their value. During this time it is best if you can leave your stock investments invested and live off of withdrawals from another source such as a bond portfolio.
In our article “How Long Should I Give An Investment Plan” we showed that the S&P 500 Index requires a time period of 7 years before the bottom of one standard deviation rises above zero to a positive 0.02% return. This suggests you might frequently need to leave your stock investments invested for at least 7 years. And in our article “Your Asset Allocation Should Be Priceless” we showed mathematically why allocating some amount to bonds can save a portfolio undergoing regular withdrawals.
Given all of this data we suggest that clients have at least 5-7 years of safe withdrawals invested in stable fixed income securities.
While a buy and hold strategy would have had no price appreciation from Prior High to Full Recovery, rebalancing or purchases made throughout the trough would have had capital appreciation by the time the markets had fully recovered.
After recovery, the market continued its upward trend for an additional 4.5 months. The total 75 month (6.2 years) bull market ultimately peaked on 11/28/1980 at 140.52, up 125.63% from the bottom of the bear market. During the total recovery from the bottom, the markets experienced an annualized return of 14.13%.
Photo used here under Flickr Creative Commons.
