 While many investment managers require their clients to liquidate their holdings to cash, we assume management of new client’s existing positions. From there, we evaluate holding by holding whether it is more advantageous to sell or hold.
Many of our new clients come to us after having worked with a commission-based advisor or a “mutual fund guy.” Because of this, their existing holdings include several funds with higher than desired expense ratios, purchased a long time ago, and never trimmed. Now, this means that they have a holding with a high expense ratio (costs a lot to hold) which also has very large unrealized capital gains (costs a lot to sell).
While this problem is hard to eyeball, it is relatively easy to math out.
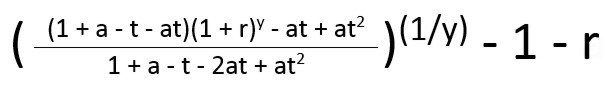
Where (r) is the annual rate of return, (a) is the percent unrealized gain in the security, (t) is the investor’s capital gains tax rate, and (y) is the number of years the investment will be held.
We use a set of complex formulas to help decide when highly appreciated investments should be sold and the proceeds put in a different investment philosophy.
As far as I know these formulas are unique to our firm, as we formulated the premises and worked out the algebra by hand. They are significant enough, I would hope that one day they are part of financial planning textbooks.
We use these formulas to determine how much additional future return you must earn in a new investment in order to overcome the cost of realizing gains at the current rate. In order to run the analysis, you must choose:
- How long will you hold the investment before we should decide whether sell or hold wins?
- At the end of the analysis, will your held security get a step-up in cost basis from death?
- What should we assume is the annual rate of return of the held security?
- If you sell, what is the tax rate your realized capital gains will experience? (Take into consideration state taxes, federal qualified taxes, and Net Investment Income taxation.)
An Example with Expense Ratio
For a long time, iShares was the only fund company that had reasonably priced country-specific exchange-traded funds (ETFs). As they advertise on their website , “With 66 funds across 42 countries, iShares offers the world’s broadest range of country ETFs.” The expense ratios on their country-specific ETFs sit right around 0.51%.
Recently, Franklin Templeton created 23 country-specific ETFs with expense ratios around 0.09%. In addition to being cheaper, the Franklin Templeton funds typically have more holdings, making them more diversified in their sector.
Take iShares MSCI Switzerland ETF (EWL) and Franklin FTSE Switzerland ETF (FLSW).
EWL has 47 holdings and an expense ratio of 0.51%. FLSW has 54 holdings and an expense ratio of 0.09%. They are near identical funds except that the Franklin fund is 42 basis points cheaper.
When compared in this manner, one would imagine that the Franklin fund would be the overwhelming winner. Surely, the Franklin funds would have more investors than iShares. Surely, iShares would have pressure to make their fund better or lower the cost. Alas, capital gains taxation has made the opposite true.
EWL was opened in 1996 and has $1.57 Billion invested as of September 2021. FLSW was opened in 2018 and has $38.38 Million invested as of September 2021.
Franklin funds isn’t competing with iShares for investors; they are competing with the capital gains tax.
This is how the capital gains tax is economically destructive. It traps capital in inefficient investments and forces taxpayers to make odd decisions to engage in smart tax planning.
Some investors should not realize the gains in their iShares fund even though they could have 0.42% higher returns each year by making the switch. Others can benefit from biting the tax bullet to make the swap.
Here is how we can use hurdle rates to decide.
Let’s imagine a forty-year-old investor who resides in Virginia. Imagine that this investor owns two trade lots of EWL. The trade lots have capital gains of 77.67% and 32.03% respectively. If the investor sells these trade lots, they are going to be subject to a 15% marginal federal capital gains rate and a 5.75% marginal Virginia state tax rate. If they continue to hold EWL, they suspect they might be able to get an annual return of 8% over the next 10 years.
Using our formula, this puts the hurdle return for the two trade lots at 0.56% and 0.30%. The hurdle return is the amount of additional return we would need to suspect that our new purchase would be able to earn over our sale in order to breakeven.
In this case, EWL and FLSW are tracking the same country as a benchmark. As a result, we would suspect EWL and FLSW to have approximately the same return with one exception. We would suspect FLSW to have an advantage of 0.42% annually thanks to its lower expense ratio.
When we compare this advantage to our hurdles, we find that the trade lot with a 77.67% unrealized gain should stay unrealized. It’s hurdle is 0.56% and we do not have reason to suspect that our new purchase will beat our current holding by that much. If we want to sell this holding, we would need to do so through other means such as pairing its gains with capital losses or donating it to charity.
However, for the trade lot with a 32.03% gain, the hurdle is 0.30%. As we suspect an additional annual return of 0.42%, we benefit from selling this trade lot, realizing the capital gains on our taxes, and purchasing the new investment.
The Same Example with Step-Up in Basis
Using the same example as the first one, this time let’s imagine that the investor is 85 years old. At 85 years old, it is easy to imagine holding a security until you receive a step-up in cost basis at death.
However, if in the scenario where you hold your security you never have to pay tax on your gains, then the hurdle rates become harder to meet.
For the 85-year-old investor, holding the securities for 10-years before getting a step-up in basis, makes the hurdle returns jump to 1.03% for the lot with a 77.67% gain and 0.56% for the lot with the 32.03% gain.
Now, both positions should be held or an alternate strategy employed.
You can see that the Hurdle Report doesn’t directly tell you what you should sell and reinvest. Instead, it allows an experienced advisor to evaluate holdings where a lower cost alternative is known. Funds in some investment categories can be purchased with very low expense ratios. Other categories have funds with higher expense ratios. These categories may or may not be justified with higher expected returns.
Other Scenarios
In this article, our example of realizing the capital gains was justified by a reduced expense ratio alone. However, there are other criteria that can be used to justify realizing gains. Other examples include the rebalancing bonus; expected extra return from factors such as Freedom Investing, specific sectors, or investment types.
Also, in these examples we are running the hurdle analysis alone. In the case of a real investor, this type of hurdle analysis is best completed as part of a larger tax planning strategy. How much gain to realize each year is an important part of effectively navigating IRMAA Medicare surcharges and creating a systematic Roth conversion plan.
Lastly, these hurdle rates are unnecessary when selecting which securities to sell in order to fuel your cash withdrawal needs. That decision should be made more based on the projected taxation owed for the specific dollar amount of unrealized gains you would be realizing.
In a tax planning strategy, you may want to intentionally realize a little capital gains each year or in years when you find yourself in the 0% federal capital gains tax bracket.
These complex formulas help decide when highly appreciated investments should be sold and the proceeds put in a different investment philosophy. If you are interested in becoming a client, we would be happy to meet with you. Our prospective client meetings are free and it is easy to get started as a client.
Photo by Kaizen Nguyễn on Unsplash
Latest posts from David John Marotta
- #TBT A Review of Finances at Age 60 - July 25, 2024
- #TBT Implement the Automatic Millionaire at Schwab - July 18, 2024
- #TBT Stress Is Not Your Enemy - June 27, 2024
Latest posts from Megan Russell
- Four DPOA Limitations at Schwab and Their Solutions - July 23, 2024
- #TBT Implement the Automatic Millionaire at Schwab - July 18, 2024
- How to Implement a DPOA at Schwab - July 16, 2024