 It is a simple thought experiment. Would you rather invest in South Korea, “a world leader in electronics, telecommunications, automobile production, and shipbuilding,” or in North Korea, where “corruption is endemic at every level of the state and economy”? The obvious choice is South Korea. Making the choice to favor the free countries of the world over their more repressed counterparts is what we call Freedom Investing.
We have been advocating Freedom Investing since 2004. Every year, the Heritage Foundation evaluates all the world’s countries using their Index of Economic Freedom, where a high score correlates to nearly every positive measure of a country. We then use this ranking and efficient frontier analysis to craft our Foreign Stock investment strategy that we call “Freedom Investing.”
Although in past articles, we have taken the simple approach of back testing the current country-specific allocations, for this article I wanted to do a more complete retrospective. The question at hand is to test our methodology — how we pick which countries to invest in, how we determine their weights, and how those selections change in response to data. In this way, I have downloaded the Index of Economic Freedom data from 2020 back to their first year of data in 1995. I have also downloaded the monthly country-specific MSCI fund returns for each country as well as the EAFE Index returns to use as a comparison from January 1995 to April 2020. Along with this data, I have also used the size weight of each country to develop what our static country-specific asset allocation would have been each month of those 25 years if we had been doing Freedom Investing for the whole time.
Country Criteria
We’ve been developing our Freedom Investing strategy for almost two decades. Over that time period, we have modified and refined our criteria for what needs to be true for a country to receive a Freedom Investing allocation. Currently for 2020, our criteria selects 11 countries from the 23 foreign developed countries. However, in some years where countries have less economic freedom, it focuses its allocation in perhaps 5 or 8 countries.
Although Heritage sets the criteria for “free” at an overall score of over 80, we draw the line for Freedom Investing at an overall score of 75 and include a second criteria of having an Investment Freedom score of over 70.
Investment Freedom is defined by Heritage as, “an environment in which individuals and companies are free to choose where and how to invest, capital can flow to its best uses: to the sectors and activities where it is most needed and the returns are greatest.” They observe that, “Restrictions on the movement of capital, both domestic and international, undermine the efficient allocation of resources and reduce productivity, distorting economic decision-making.” We believe countries with low Investment Freedom scores may not have as high of an expected return even if they have a high overall freedom score.
Because expense ratio is such a strong predictor of future returns, we also require each country have an available fund with a reasonable expense ratio. In 2020, a reasonable expense ratio for a country-specific fund currently means an expense ratio of below 0.6%, though as funds get cheaper our line of reasonable moves cheaper as well.
In the investing world, countries are divided into categories by their size. Developed countries are the largest, emerging markets are the mid-sized category, and frontier markets are smaller countries. There also exist some countries so small they cannot be invested in.
We use Freedom Investing to create our Developed foreign stocks allocation and compare its returns to the EAFE Index as a benchmark.
We also invest in Emerging markets and do use country-specific indexes to tilt towards freer countries, but it is unfair to compare those investments to the EAFE Index as Emerging Markets both expect more volatility and a higher return than the developed countries. As a result, I will save our Emerging market freedom analysis for another article.
Because frontier markets are such a small part of the market and because country-specific frontier market funds are not available for a reasonable expense ratio, we do not currently invest in frontier markets, although there have been some free countries in this classification from time to time.
Overview of Free Countries
Back in 1995, some countries had not yet received rankings and of those that did there were only 3 countries that met our criteria to be used in Freedom Investing: Hong Kong with an overall score of 88.6 and an Investment Freedom score of 90, Singapore with 86.3 and 90, and United Kingdom with a score of 77.9 and 70.
With an overall score of 75, Japan passed our initial criteria of overall score but its Investment Freedom score was too low with only a 50 excluding it from Freedom Investing.
Both New Zealand and Switzerland were given an “N/A” rating in 1995, but in 1996 they were given overall scores of 78.1 and 76.8 respectively along with Investment Freedom scores of 70 and 90 respectively. These high freedom scores continued throughout the 25 years. For this reason, I used their 1996 ratings for 1995 as well and included them in the allocation.
In 1997, Australia and Chile both passed the criteria. Australia moved from a score of 74 the year before to 75.5 in 1997 and its consistent Investment Freedom score of 70 kept it in the allocations. Chile is an emerging market, and thus not part of this developed stock allocation, though we do invest in it as part of our Emerging Market allocations.
In 2000, Ireland gets an allocation having improved their overall score gradually from 68.5 in 1995 to 76.1 in 2000. It also improved its 70 Investment Freedom to an impressive 90 by 2001.
Although the Netherlands always had a great Investment Freedom score, it took until 2002 to improve its overall score to a 75.1 from a 1996 score of 69.7. Unfortunately, the Netherlands freedom score dipped above and below the 75 line and was only included with an allocation during 2002, 2006-2010, and 2017-2020 present.
By 2005, Denmark improves itself to an overall score of 75.3 which increases to 78.3 by 2020.
Canada joins the allocation in 2008 having brought its Investment Freedom up from 50 to 70 and boasting an 80.2 overall score.
In 2018, Sweden pulled its score up to 76.3 from 72 just two years earlier, but by 2020 it dipped back to the just shy score of 74.9. As a result, Sweden is currently not in our freedom allocations.
The newest country to pass the criteria is Finland, which just achieved an overall score of 75.7 in 2020 after years of hovering close to a score of 74.
Although only four of those initial five countries (Hong Kong, Singapore, New Zealand, and Switzerland) were consistently part of the allocation throughout the whole time period, over the course of the 25 years between 1995 and 2020, there have been 12 foreign developed countries that met the freedom scores criteria: Australia, Canada, Denmark, Finland, Hong Kong, Ireland, Netherlands, New Zealand, Singapore, Sweden, Switzerland, and United Kingdom. At the end of the analysis in 2020, the Freedom Investing countries included are all of these except Sweden.
A Closer Look at Returns
Here is a comparison of $10,000 invested in the EAFE Index on December 31, 1994 compared to $10,000 invested in and rebalanced to the blended Freedom Investing asset allocation over the same time period.
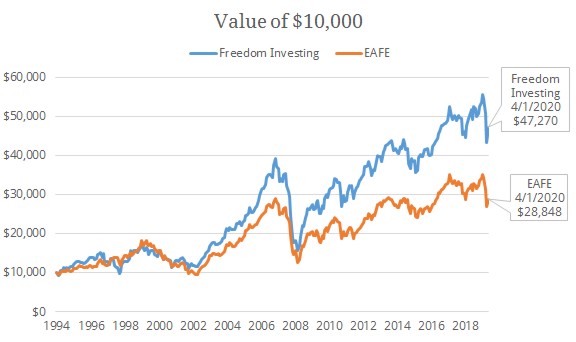
As you can see, the $10,000 in the Freedom Investing portfolio grew to $47,270, which is an annual rate of return of 6.323%. Meanwhile, the EAFE Index grew only to $28,848, which is an annual rate of return of 4.271%. That means that over these measured 25 years, Freedom Investing had a 2.053% annual advantage over investing in the EAFE Index alone.
When testing an investment strategy or fund using historical data the start and end date matter significantly. Although a 25-year advantage is a wonderful finding in support of Freedom Investing, there is no way of knowing it if tells the whole story. Furthermore, 25-years of data is actually a relatively small amount of available data in the world of investing. Even 30 years of returns may be insufficient to be predictive of the next 30 years.
To make the most of the data that we have, the best way to test this strategy is to create rolling returns. By generating a rolling return, where the amount of time between the start and end date is fixed but the start and end month are rolled forward by one, you are better able to see the advantage or disadvantage of a strategy regardless of start and end dates.
In this way, we are able to acquire more possible return combinations. For example, although we only have 25 years of Freedom Investing data, we have 65 different 20-year rolling returns or 245 different 5-year rolling returns within that data.
In these graphs I have subtracted the EAFE Index rolling return for various time periods from the Freedom Investing rolling return over the same time period to show Freedom Investing’s advantage over the EAFE Index as a positive number and its disadvantage as a negative one.
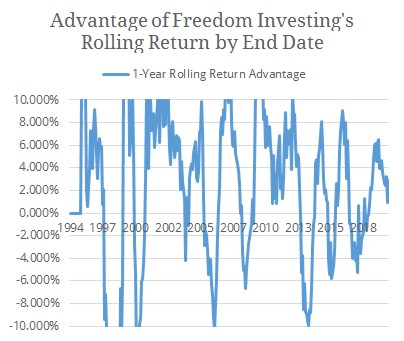
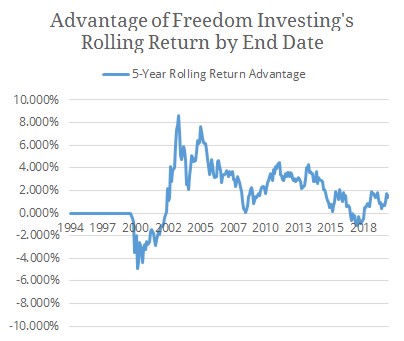
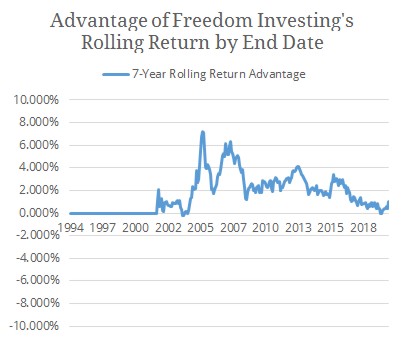
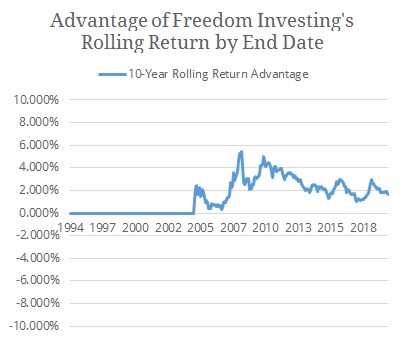
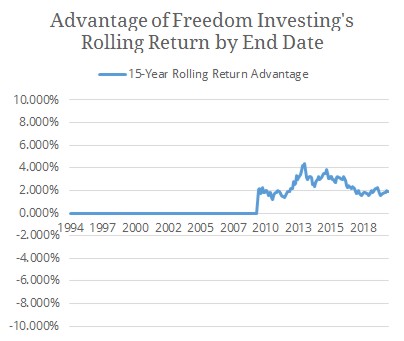
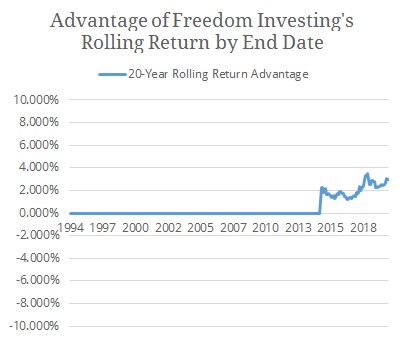
As you can see from the graphs, on average, Freedom Investing has had an advantage over the EAFE Index. In fact, on average Freedom Investing has a 1-year advantage of 2.093%, 5-year advantage of 1.995%, 7-year advantage of 2.314%, 10-year advantage of 2.400%, 15-year advantage of 2.392%, and 20-year advantage of 2.073% over the EAFE Index.
Despite these average advantages, there still exist several 1-year, 5-year, or 7-year time periods where the EAFE Index beats Freedom Investing. We would expect any factor investing strategy to have short-term time periods of disadvantage due to the inherent volatility of the markets.
Of the 293 measured 1-year periods, Freedom Investing lost to the EAFE Index in 96 of them, which is 32.765%. Of the 245 measured 5-year periods, Freedom Investing lost to the EAFE Index in 45 of them, which is 18.367%. Of the 221 measured 7-year periods, Freedom Investing lost to the EAFE Index in 5 of them, which is 2.262%. However, of the 185 measured 10-year time periods, Freedom Investing lost to the EAFE Index in 0 of them. The same was true for 15- and 20-year time periods with Freedom Investing winning in all of them.
Conclusions
These findings together demonstrate how Economic Freedom seems to have been a valid factor for higher expected returns than investing in the EAFE Index alone.
If you would like to get started with Freedom Investing, we implement our freedom strategy at all service levels of our portfolio management. You can simply give us a call or drop us a message, and we would be happy to talk with you about how to get started as a client.
Photo of Singapore by Peter Nguyen on Unsplash