We are strong advocates of index investing. But which index funds? There are about 1,500 of them. Many follow the S&P 500, which represents just half an asset class. Other funds follow obscure indexes such as the Market Vectors Colombia ETF (COLX).
We use several country specific funds in order to over-weight the countries with the most economic freedom according to the Heritage Foundation’s Index of Economic Freedom. Between 2000 and mid way through 2014, countries high in economic freedom outperformed both the EAFE foreign index and the S&P 500. Economic freedom matters, and despite dropping out of the free category in 2010 the United States still ranks among the freest countries in the world.
Freedom investing makes sense. Libertarians and economists both recognize that countries with more economic freedom experience higher growth of GDP.
We’ve analyzed freedom investing by its returns. But how do countries with the most economic freedom correlate to each other? Do they move more in sync with the United States or the EAFE foreign index? Should we have a “Free Countries Asset Class” or a “Foreign Stock Asset Class?”
To answer that question, I analyzed the correlation between the iShares Core S&P 500 ETF (IVV) and iShares MSCI EAFE ETF (EFA) against the six countries that ranked the highest in economic freedom (Hong Kong, Singapore, Australia, New Zealand, Switzerland and Canada).
Here are the correlations over the past 3-years:
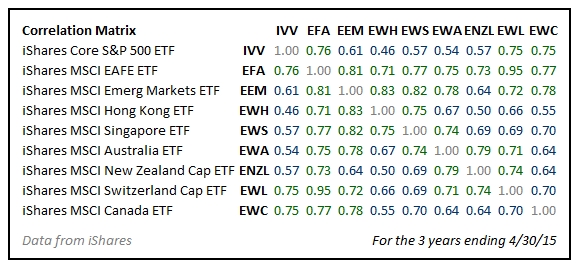
Interestingly, the average 3-year correlation of the iShares MSCI EAFE ETF (EFA) to these six countries is 0.78 while the average correlation of the iShares Core S&P 500 ETF (IVV) to the same six countries is only 0.61.
I think this 0.17 difference in correlation definitively answers that freedom investing belongs in the foreign stock category rather than in an asset class with the United States. In fact, the average correlation of each of the six countries with the other five is higher than the average of their correlation with the United States: Hong Kong (0.63), Singapore (0.71), Australia (0.71), New Zealand (0.67), Switzerland (0.70), and Canada (0.65).
This chart shows that the United States and Canada often move in sync with each other with a 3-year correlation of 0.75 and that Australia and New Zealand also mirror each other with a 3-year correlation of 0.79.
Perhaps most interesting is the 0.95 correlation between Switzerland and the EAFE foreign index. As of the end of March 2015, the 3-year annualized return of iShares Switzerland (EWL) has been 12.69 while the return of iShares EAFE (EFA) has only been 8.92. I suspect that this is because though the two indexes have moved similarly for the last 3 years, the Swiss currency has held its value better against the dollar each year by 3.77%.
Much like Resource Stocks , foreign investing boasts diversification in its underlying assets even greater than it does as an asset class as a whole.
In a separate article we showed that the correlation between different styles of US stocks (large-small, value-growth) reveals less diversification than we’ve just found in freedom investing. For this reason, advisors who have a US-centric investment philosophy and just a generic allocation to foreign stocks miss an important opportunity to diversify their portfolios.
Photo used here under Flickr Creative Commons.
Latest posts from David John Marotta
- #TBT A Review of Finances at Age 60 - July 25, 2024
- #TBT Implement the Automatic Millionaire at Schwab - July 18, 2024
- #TBT Stress Is Not Your Enemy - June 27, 2024