In 2003, the Goldman Sachs Global Economics Department predicted the economic and geopolitical influence of Brazil, Russia, India and China (the BRIC countries) would become increasingly visible in the developed world and even dominate it by 2050. In 2008, we reviewed the performance and economics of each country.
From 2003-2008, the BRIC subset beat the Emerging Markets Index annually by a whopping 11.07%.
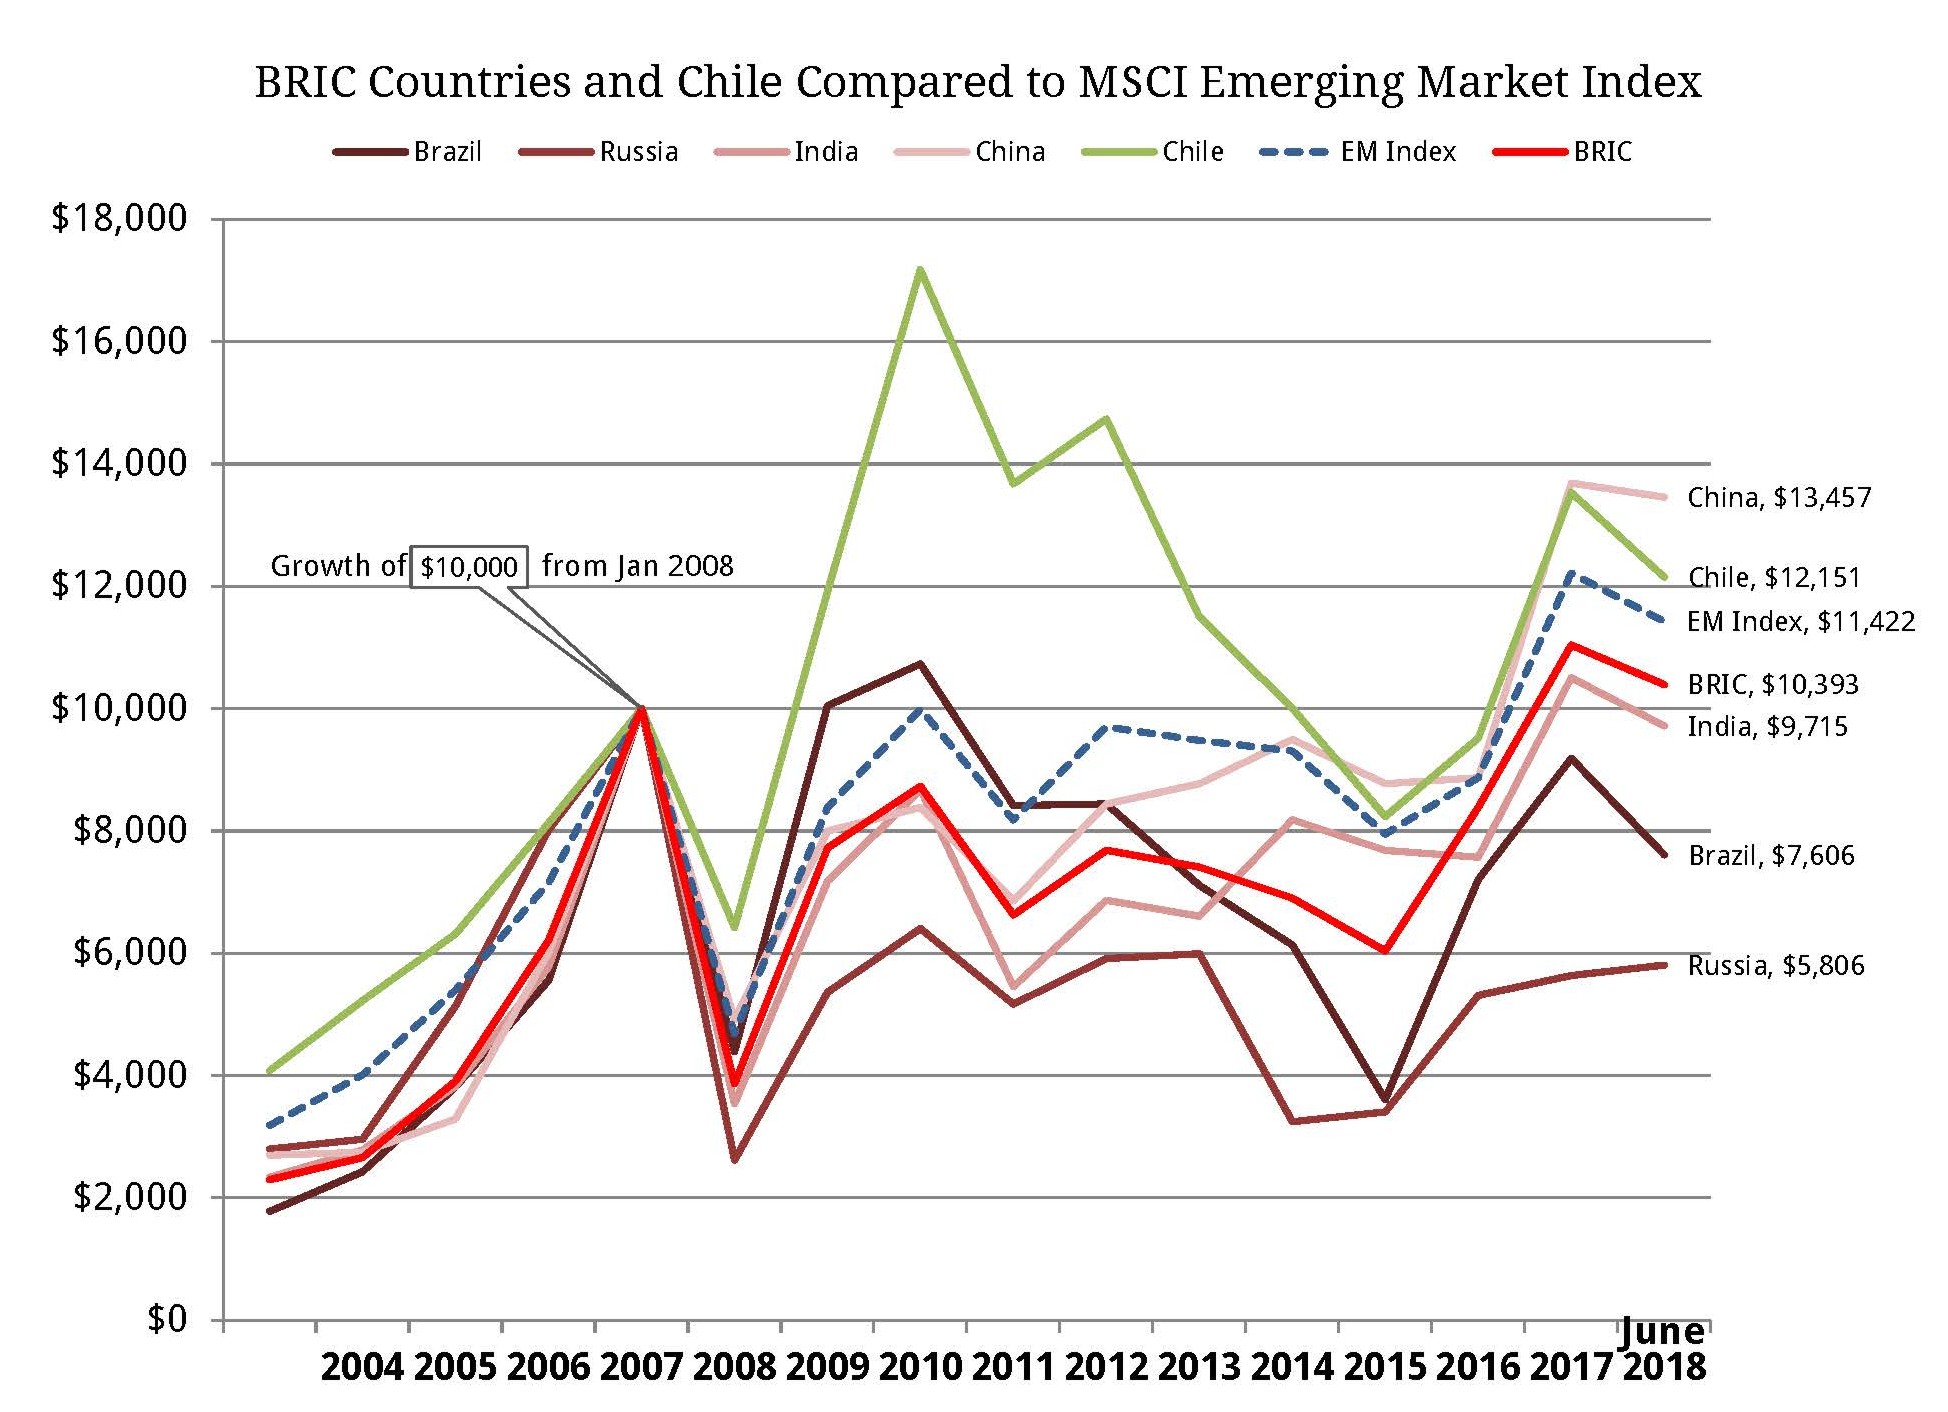
Our review was published a little over ten years ago on the eve of the 2008 Financial Crisis. We decided to revisit these emerging market countries a decade later to see how these investments fared during the ten and a half years starting at the beginning of 2008 and ending halfway through 2018. Here is a chart showing the growth of $10,000 at the beginning of 2008 for some of these emerging market countries.
Emerging Markets
When computing average index returns, the starting date is as important as the ending date.
For the MSCI Emerging Markets Index, if you start at the beginning of 2008, it has averaged an annual appreciation of 1.27% over the past 10.5 years. If you start one year later at the beginning of 2009, it has averaged an annual appreciation of 9.84% over the past 9.5 years.
This fact simply supports the principle that it is important to stay invested after a market drop. The beginning of 2009 might have seemed like a terrible time to be invested, but the MSCI Emerging Market Index appreciated 79.02% that year.
For the past 5.5 years (1/1/2013 to 6/30/2018), the MSCI Emerging Markets Index had an average return of 3.02%. It had 6.03% for the past 3.5 years (1/1/2015 to 6/30/2018).
These numbers may seem low, but that is because 2015 was another down year with emerging markets losing -14.60%. In the 2.5 years from the beginning of 2016, emerging markets have averaged 15.61%.
All markets are inherently volatile, but emerging markets has an even greater volatility. The volatile assets in your portfolio can feel like they do nothing but go down. This is often just loss aversion which is the psychological effect that you feel the pain of a loss two and a half times as much as you enjoy gains.
Low correlation and high volatility are the source of the rebalancing bonus. Thus, having assets with these two characteristics (low correlation and high volatility) may result in higher returns.
Here is a color-coded heat map of the annual returns listed best to worst for each year from 2004 to June 2018 as well as the 10.5 years starting in 2008 and the 14.5 years starting in 2004:
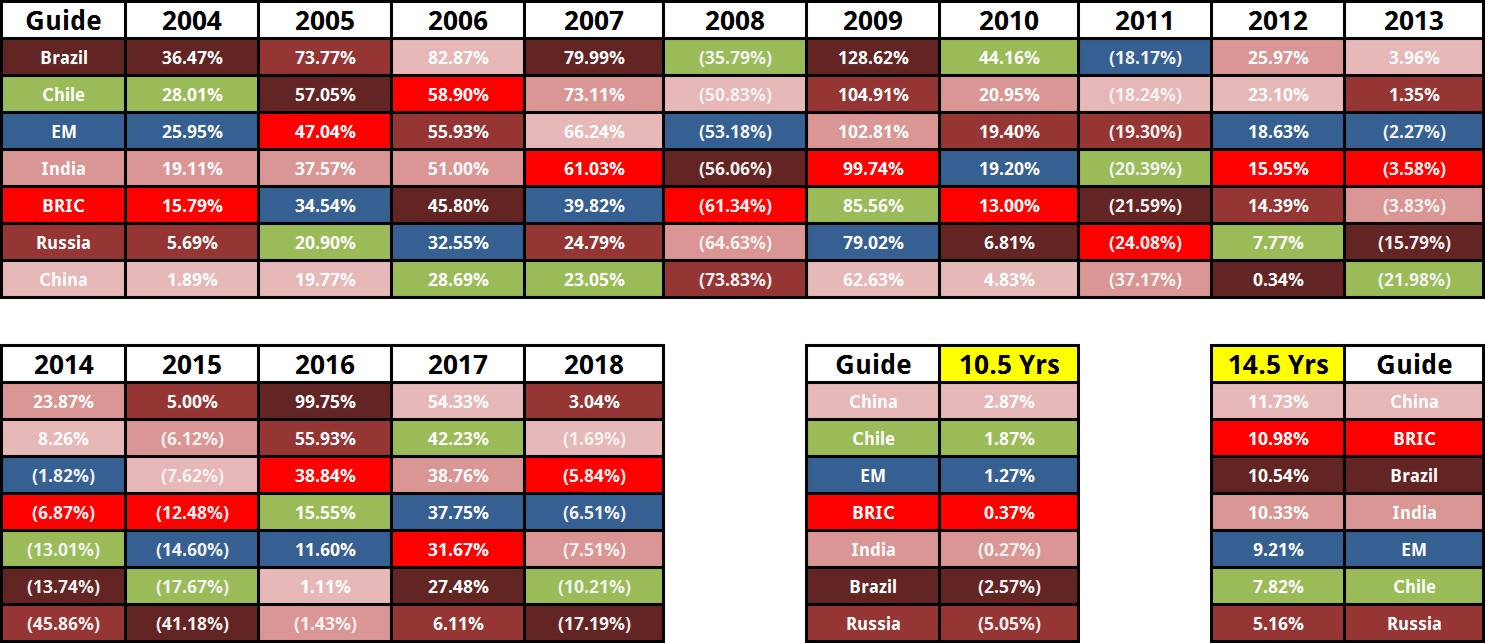
An equal weight of the BRIC countries averaged an annual appreciation of 0.37% over the past 10.5 years starting at the beginning of 2008 (compared to 1.27% for the index) or 10.98% over the past 9.5 years starting at the beginning of 2009 (compared to 9.84% for the index).
They also averaged an annual appreciation of 5.65% for the past 5.5 years (1/1/2013 to 6/30/2018; compared to 3.02% for the index) and 12.42% for the past 3.5 years (1/1/2015 to 6/30/2018; compared to 6.03% for the index).
In other words, BRIC Countries have under performed the emerging market index over the past 10.5 years but performed better than the index recently and if you go back 14.5 years.
Brazil
The MSCI Brazil Index has averaged an annual appreciation of -2.57% over the past 10.5 years starting at the beginning of 2008 or 5.95% over the past 9.5 years starting at the beginning of 2009.
Ten years ago I wrote about Brazil:
Brazil has potential, but a lack of economic freedom still holds the country back. Graft and corruption are rampant at every level of government. Injustice is commonplace. Who people know determines the amount of bureaucratic regulation they have to suffer. “For my friends, everything. For strangers, nothing. For my enemies, the law.” This common Brazilian adage is a sobering reminder of the mindset there. …
The resulting extreme inequity between the haves and the have-nots in Brazil motivates the latter group to seek relief politically. More than 30% of the population live below the poverty line and identify with the socialist and communist political parties.
But as political activists press for more laws, opportunities increasingly open up for unequal application by corrupt officials. This blocks the development of commerce. A professional class of intermediaries is required to facilitate introductions and grease governmental red tape. Substituting personal relationships for the rule of law also creates instability, so entrepreneurs hesitate to take risks. As a result, a well-intentioned socialism actually helps perpetuate the opportunity for abuse and inequality.
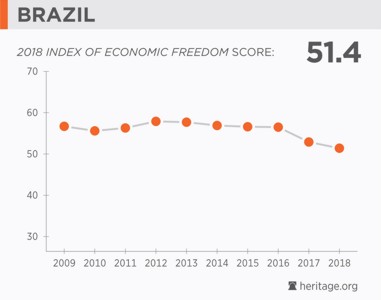
Although Brazil is still the freest of the BRIC countries, since 2008 Brazil’s Economic Freedom Score has dropped even further. Government spending increased the country’s debt from 52% of Brazil’s gross domestic product in 2013 to 74% in 2016.
Brazil had an average return of -1.88% for the past 5.5 years (1/1/2013 to 6/30/2018) and 6.35% for the past 3.5 years (1/1/2015 to 6/30/2018).
Russia
Ten years ago when articles were suggesting to invest in Russia I wrote:
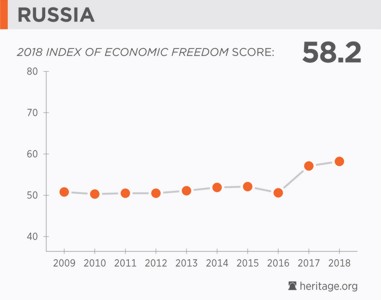
Although it never really tried free markets, Russia has fallen back into the familiar weaknesses of a controlled economy hindered by bureaucratic restrictions, inconsistencies and corruption. Rated at just below 50% free, Russia earned the Heritage Foundation’s lowest economic freedom ranking, repressed and on a par with countries like Vietnam, Guyana, Laos and Haiti. …
We suggest you limit any assets invested in Russia to a very small portion of your emerging market allocation.
Over the past 10.5 years the MSCI Russia Index has averaged an annual appreciation of -5.05% and over the past 5.5 years -0.33%.
On the other hand over the past 9.5 years it has averaged 8.75% and over the past 3.5 years 18.10%.
Even though Russia’s volatility occasionally results in it performing well, it was the worst of the BRIC countries overall. While economic freedom is not the reason why emerging market countries perform well, a lack of freedom can still cause serious problems. What I wrote ten years ago remains true of Russia, “When money talks, the truth stays silent.”
India
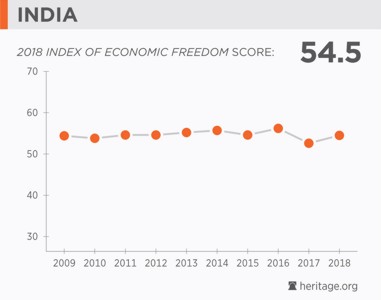
The MSCI India Index has averaged an annual appreciation of -0.27% over the past 10.5 years starting at the beginning of 2008 or 11.22% over the past 9.5 years starting at the beginning of 2009. And the MSCI India Index has had an average return of 6.51% for the past 5.5 years (1/1/2013 to 6/30/2018) and 5.04% for the past 3.5 years (1/1/2015 to 6/30/2018).
The Indian economy has many government interests that fight against any reduction of regulations and work to pull down any efforts to increase economic freedom.
India even legislates a list of items banned from production in large-scale plants. And because such lists are updated regularly, the potential for bribery is rampant. Like other BRIC countries, centralized planning breeds corruption. …
The best check on greedy people certainly is not to create a whole caste system of government bureaucrats and then tempt them with an overabundance of laws to enforce subjectively.
The greedy business man seeking to increase his own wealth and power is a common theme in movies and literature. The government bureaucrat protecting his own influence and power is a much more common theme in real life.
Voters routinely underestimate the powerful influence of rent-seeking to produce the negative results of a helicopter government. And since these incentives pull societies toward less economic freedom it takes a powerful citizenry committed to advancing freedom simply to hold the status quo.
China

The MSCI China Index has averaged an annual appreciation of 2.87% over the past 10.5 years starting at the beginning of 2008 or 11.18% over the past 9.5 years starting at the beginning of 2009. And the MSCI China Index has an average return of 8.86% for the past 5.5 years (1/1/2013 to 6/30/2018) and 10.47% for the past 3.5 years (1/1/2015 to 6/30/2018).
Although China remains “unfree,” it has had the greatest increase in economic freedom among the BRIC countries. These reforms began under Deng Xiaoping who was the communist leader from 1978 to 1989. As I wrote ten years ago:
Deng argued that “socialism does not mean shared poverty.” His most famous quote clarifies his utilitarian nature: “I don’t care if it’s a white cat or a black cat. It’s a good cat so long as it catches mice.”
Deng Xiaoping is also known for a quote in 1992 after his retirement: “Let some people get rich first.”
Since Deng Xiaoping that is exactly what has happened. China has developed into a small privileged minority who are allowed to compete in a free market and a large majority working as inexpensive labor. Because of China’s population, if the small minority engaged in capitalism (just 10% of China’s population), it is larger than all the full time employees working in the United States.
Those allowed to compete are increasingly supportive of suppressing the economic freedom of China’s masses and quelling any political dissent. In 2014 China began tracking a social credit system which aggregates data from both public and private sources to judge a citizen’s likelihood to do whatever routine behaviors are judged to be in the best interests of the country. For those soft socialists who believe that the United States government should nudge people toward what the government deems is in the best interests of society, China is a leading example. Nudging people can easily become shoving people for their own good. Or as C.S. Lewis wrote in The Humanitarian Theory of Punishment :
Of all tyrannies a tyranny sincerely exercised for the good of its victims may be the most oppressive. It may be better to live under robber barons than under omnipotent moral busybodies. The robber baron’s cruelty may sometimes sleep, his cupidity may at some point be satiated; but those who torment us for our own good will torment us without end for they do so with the approval of their own conscience.
The Chinese economy benefits from a compliant and inexpensive work force even if only a small percentage of the elite in China benefit from the economy. Most of the benefit of investing in the emerging markets is a result of having inexpensive labor costs. For this reason most of the manufacturing in the world is done in the emerging markets. As a country’s workforce’s standard of living rises labor costs rise and manufacturing shrinks as a percentage of the country’s gross national product. As a country’s standard of living rises more of its workforce is working in services. Economic freedom also becomes more important to the country’s success.
Turkey and Eastern Europe
Countries continue to move out of the emerging markets and into the developed markets. Other countries move into the emerging markets from the frontier markets. The list of countries in the emerging markets gradually changes and is slightly different between the MSCI Emerging Markets Index and the FTSE Emerging Markets Index.
Ten years ago Turkey and Eastern Europe were part of the frontier markets (also called “pre-emerging markets”), but now Turkey is in the FTSE Emerging markets while Croatia, Estonia, Latvia, Lithuania, Republic of Macedonia, Romania, and Serbia are still classified as frontier markets by FTSE.
The largest frontier market ETF is the iShares MSCI Frontier 100 ETF (FM) with a five-year return of 4.14% compared to the 4.42% five-year return of the iShares MSCI Emerging Markets ETF (EEM). While there is nothing wrong with investing in the frontier markets, the 0.69% expense ratio of FM makes it a less attractive option.
Chile

Chile is one of the few emerging market countries which is also relatively high in economic freedom. Although Chile is a small economy, we invest a portion of our foreign stock allocation specifically to Chile and as a result I thought it was worth including in this article.
In January of 2016 we wrote the article “Why Invest In Chile?” after the Chilean markets had experienced a -50.64% drop over the previous five years. Our analysis showed that while the drop was unfortunate, portfolios that included Chile had still been both more profitable and less volatile. Our defense of Chile was justified as Chile appreciated 17.98% in 2016 and then a whopping 42.89% in 2017.
The MSCI Chile Index has averaged an annual appreciation of 1.87% over the past 10.5 years starting at the beginning of 2008 or 6.94% over the past 9.5 years starting at the beginning of 2009. And the MSCI Chile Index has an average return of -3.45% for the past 5.5 years (1/1/2013 to 6/30/2018) and 5.72% for the past 3.5 years (1/1/2015 to 6/30/2018). While all of these returns include the market declines of 2013-2015, the three-year returns from 6/30/2015 through 6/302018 have averaged 28.19%.
Conclusions
While the emerging markets as a whole have not had the best decade of returns, historically this is a good category for a portion of your portfolio. Additionally we believe that the emerging markets as a whole currently have a favorable forward price to earnings ratio.
While the BRIC countries represent about 58% of the FTSE Emerging Markets Index, we don’t believe that there is any advantage to over weighting these four countries. It would be more advantageous to invest according to factors such as small, value, freedom, or forward P/E ratio.
And while we are open to finding a low-cost exchange-traded fund (ETF) that blends companies in the emerging markets according to proven factors, the 0.13% expense ratio of Schwab Emerging Markets Equity ETF (SCHE) and the 0.14% expense ratio of Vanguard FTSE Emerging Markets ETF (VWO) make those ETFs affordable attractive options.
2008 BRIC Series

BRIC Countries: Russia
Russia never really tried free markets. Rated at just below 50% free, Russia is considered repressed.

BRIC Countries: A Passage to Indian Freedom
“The fence itself grazed through the field.”

BRIC Countries: China
Free markets thrive when a country guarantees property rights and the rule of law. China possesses neither of these.

Eastern Europe and Turkey: BRIC Wannabes
Eastern European countries have been struggling out of the darkness of communist rule into the light of free markets.

BRIC Countries: Brazil
One area where Brazil has excelled is making headway toward energy independence.
Latest posts from David John Marotta
- #TBT A Review of Finances at Age 60 - July 25, 2024
- #TBT Implement the Automatic Millionaire at Schwab - July 18, 2024
- #TBT Stress Is Not Your Enemy - June 27, 2024
Latest posts from Megan Russell
- Four DPOA Limitations at Schwab and Their Solutions - July 23, 2024
- #TBT Implement the Automatic Millionaire at Schwab - July 18, 2024
- How to Implement a DPOA at Schwab - July 16, 2024