This past year was an interesting year in the markets. Instead of calling it a “stock market,” 2020 may have been more accurately called a “market of stocks” with some industries and companies doing very well while others struggled to stay in business.
The year started with moderate returns before the 2020 COVID Bear Market in March. The bear market was 33 days from prior peak to relative bottom and 148 days from relative bottom to new high.
After its recovery, the stock market went on to set multiple new highs throughout the rest of the year.
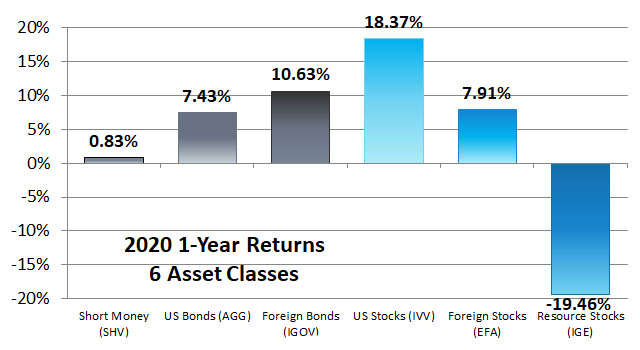
Looking closer, here’s how our top six asset classes performed between January 1 and December 31, 2020.
Short Money
During volatile markets, going to cash is a temptation which must be resisted. This year, cash investments earned 0.83%. When you compare these returns to the other asset classes, you can see that the opportunity cost of cash was high.
Going to cash is almost never the right answer, but to make it worse many investors are tempted to go to cash at the worst time possible.
There is no way to know what the markets will do. There are many possible futures which could produce any number of outcomes that would be normal market volatility.
We devoted much of our columns during 2020 to reminding people that getting out of the markets, selling the bounce, or going to cash during election years are foolish, fearful strategies.
U.S. Bonds
We use our U.S. Bonds to represent the first four years of our seven-year allocation to Stability. Here is the return of our U.S. Bond funds.
- 3.11% Schwab Short-Term U.S. Treasury ETF (SCHO)
- 10.86% Schwab U.S. TIPS ETF (SCHP)
- 7.46% Schwab U.S. Aggregate Bond ETF (SCHZ)
Because interest rates dropped and the year was full of uncertainty, U.S. Bonds had above-average performance for 2020.
Foreign Bonds
Our foreign bonds are generally where we keep years five through seven of a client’s withdrawal rate.
During 2020, the U.S. dollar slipped in value against local currencies causing foreign bonds measured in local currencies (like IGOV) to appreciate more than those hedged to the U.S. dollar (like the Vanguard funds on our Buy List).
We used to invest in foreign bonds which were measured in local currencies. Although local currencies may boost returns, it also makes the bonds more volatile. Ultimately, we decided that it was worth a slightly lower return to keep our Stability allocations more stable.
Here is the return of our foreign bond funds:
- 4.63% Vanguard Total International Bond ETF (BNDX)
- 5.76% Vanguard Emerging Markets Government Bond ETF (VWOB)
U.S. Stocks
The U.S. stock market as measured by iShares Core S&P 500 ETF (IVV) went up 18.37% during 2020. After that growth, the S&P 500 became more concentrated in the top few holdings. Now, 27.60% of the index is in technology and the ten largest holdings represent 28.60% of the portfolio.
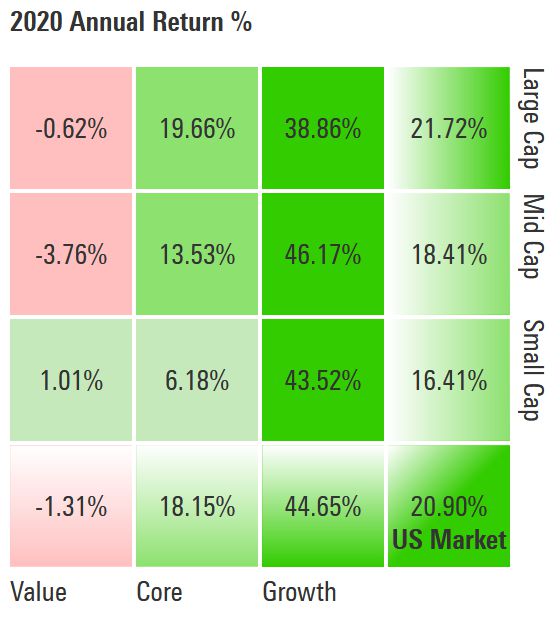
Across the style boxes, we saw a wide range of 2020 annual returns with -3.76% in Mid Cap Value and 46.17% in Mid Cap Growth. A small and value tilt did not work well this year.
Here are the returns of some of our U.S. investments:
- 46.09% Vanguard Information Technology ETF (VGT)
- 18.35% Vanguard Health Care ETF (VHT)
- 18.40% Vanguard S&P 500 ETF (VOO)
- 2.56% Vanguard Mid-Cap Value ETF (VOE)
- 5.91% Vanguard Small-Cap Value ETF (VBR)
- 48.10% SPDR® S&P® Biotech ETF (XBI)
- 10.95% Vanguard Consumer Staples ETF (VDC)
Because we added SPDR® S&P® Biotech ETF (XBI) and Vanguard Consumer Staples ETF (VDC) in the final quarters of 2020, our clients did not experience a full year of their returns. From September 1 through December 31, 2020, the returns of those two funds were:
- 26.16% SPDR® S&P® Biotech ETF (XBI)
- 5.44% Vanguard Consumer Staples ETF (VDC)
Foreign Stocks
Foreign Developed
Foreign stocks were up 7.91% as measured by the total return of iShares MSCI EAFE ETF (EFA), while the benchmark that fund follows was up 7.82%.
Meanwhile, here are the countries we invest in which are high in economic freedom compared to that benchmark:
- 43.61% iShares MSCI Denmark ETF (EDEN)
- 24.19% iShares MSCI Netherlands ETF (EWN)
- 22.26% iShares MSCI Finland ETF (EFNL)
- 19.80% iShares MSCI New Zealand ETF (ENZL)
- 13.37% Franklin FTSE Switzerland ETF (FLSW)
- 11.10% Franklin FTSE Australia ETF (FLAU)
- 10.80% iShares MSCI Ireland ETF (EIRL)
- 8.09% SPDR® Solactive Hong Kong ETF (ZHOK)
- The 7.91% return of iShares MSCI EAFE ETF (EFA).
- 5.47% SPDR® Solactive Canada ETF (ZCAN)
- -8.19% iShares MSCI Singapore ETF (EWS)
- -9.45% SPDR® Solactive United Kingdom ETF (ZGBR)
The average of the 2020 returns for these 11 countries is 12.82%. The average return for the six countries (Singapore, Hong Kong, New Zealand, Austrailia, Switzerland, and Ireland) ranked as free by the 2020 Index of Economic Freedom was 9.16%. Freedom investing gained somewhere between +1.24% and +4.90% over the EAFE this past year. In fact, only 3 countries underperformed the EAFE Index while the other 8 countries outperformed the index.
We are always looking for better funds for our Buy List. Currently, there are several funds where our only choice is to purchase an iShares fund for an expense ratio near 0.50%. When available, we prefer purchasing a Franklin Templeton Fund for an expense ratio of just 0.09%. Additionally, Franklin Funds are based off of the FTSE index instead of the MSCI index. We think that may slightly help returns. But when the choice is between a Franklin Fund and a SPDR Solastic Fund we prefer the Solastic Funds with their selection criteria of value, low volatility, and quality. We think those factors may be worth the 0.20% expense ratio over the long haul even though this year they might not have been.
Here are the returns of competing funds with the winner in blue:
| Country | SPDR Solastic | Franklin Templeton |
iShares |
| Hong Kong | 8.09% | 6.70% | 4.64% |
| Canada | 5.47% | 6.38% | 5.60% |
| United Kingdom | -9.45% | -9.38% | -10.98% |
| Switzerland | N/A | 13.37% | 12.66% |
| Australia | N/A | 11.04% | 8.32% |
In 2020, it may have been better to be invested in the Franklin fund rather than the SPDR Solastic fund, likely because value investing underperformed growth this past year. That being said, it is surprising that the three factors made such a difference in Hong Kong where the SPDR Solastic fund did significantly better.
Likewise, it is also surprising that the Franklin fund did so much better for Canada, because the Franklin fund used just 53 holdings while the SPDR and iShares used 82 and 89 holdings respectively. This is a case where using fewer holdings to approximate the index performed better as large cap out performed mid and small cap stocks.
The SPDR Solastic Funds are closing between 3/17/2021 and 3/23/2021. Therefore, we will be switching to the Franklin Templeton funds with an expense ratio of just 0.09%.
Foreign Emerging
For emerging markets, we use two different funds: Vanguard FTSE Emerging Markets ETF (VWO) and Schwab Emerging Markets Equity ETF (SCHE). Both of these funds use a FTSE version of the index for their benchmark, but they are different benchmarks. Here are their returns followed by their benchmarks’ return:
- 15.18% Vanguard FTSE Emerging Markets ETF (VWO) with 5,003 holdings and using the FTSE Emerging Markets All Cap China A Inclusion Index as an index with an index return of 15.51%.
- 14.47% Schwab Emerging Markets Equity ETF (SCHE) with 1,537 holdings and using the FTSE Emerging Index (Net) as an index with an index return of 15.12%.
Resource Stocks
Energy stock returns were disappointing during 2020. First, we reduced and then eliminated our overweight to energy. We think there was a fundamental change in the energy industry in 2015, after which stocks in this category may underperform. Here is the return of energy for the year:
- -33.03% Vanguard Energy ETF (VDE)
Now, our Resource Stock category only includes U.S. and foreign real estate investment trusts (REITs). Here are those returns:
- -4.64% Vanguard Real Estate ETF (VNQ)
- -7.15% Vanguard Global ex-U.S. Real Estate ETF (VNQI)
The pandemic has affected this sector.
Looking Forward
Industry analysts, who are responsible for the divisor (expected earnings) of forward price-to-earnings (P/E), are trying to guess how quickly the economy will pick up for industries still closed on account of the pandemic. Meanwhile investors, who are responsible for the numerator (market price), are making their own independent guesses on which industries are going to recover next.
It would appear that investors are more optimistic than industry analysts as the forward P/E ratios of almost every sector of the economy appears expensive right now.
While we are anticipating a suppressed economy for more months, eventually we would expect production to return to normal. As a result, the mismatch of price and earnings need not worry us. Even with everything appearing expensive, we still use the monthly dynamic tilt to take advantage of what discounts appear to be there.
Latest posts from David John Marotta
- #TBT A Review of Finances at Age 60 - July 25, 2024
- #TBT Implement the Automatic Millionaire at Schwab - July 18, 2024
- #TBT Stress Is Not Your Enemy - June 27, 2024
Latest posts from Megan Russell
- Four DPOA Limitations at Schwab and Their Solutions - July 23, 2024
- #TBT Implement the Automatic Millionaire at Schwab - July 18, 2024
- How to Implement a DPOA at Schwab - July 16, 2024
Latest posts from Austin Fey
- #TBT How to Make a Financial Independence Bucket - July 4, 2024
- 2024 Tax Facts - November 13, 2023
- #TBT Harvest Major Capital Losses Whenever You Have Them - October 26, 2023