 A gone-fishing portfolio has a limited number of investments with a balanced asset allocation that should do well with dampened volatility. Its primary appeal is simplicity. But a secondary virtue is that it avoids the worst mistakes of the financial services industry.
The genius of the gone-fishing portfolio is not only the time you can spend relaxing. Using the asset allocation to give you the confidence to stay invested, regardless of market volatility, is one of the portfolio’s greatest strengths. Rather than emotionally chasing returns, you get a boost from setting your target allocation and rebalancing annually or semiannually.
Annual rebalancing is close to optimum. Twice a year, in May and September, is also excellent. Whenever the market is in the news for reaching new highs or lows is appropriate too.
Our first article about Gone-Fishing Portfolios was published in 2011. Over the course of that year, we introduced the concept of a Gone-Fishing Portfolio, reviewing each asset class one at a time. Then, in 2012, we came out with our first Marotta’s Gone-Fishing Portfolio recommendation of 12 funds. Ever since then, we’ve come out with an annual update of our recommendations. Our 2021 Gone-Fishing Portfolios came out this year.
Our Gone-Fishing Portfolios are free to use portfolios that take advantage of the no-transaction-fee, low-cost exchange-traded funds (ETFs) or mutual funds of each major custodian. Over the years, we’ve changed the funds and the allocations as new research or securities reveal improvements.
Using just our Appreciation (stock) allocations, here’s how our Gone-Fishing Portfolio allocations have changed over time:
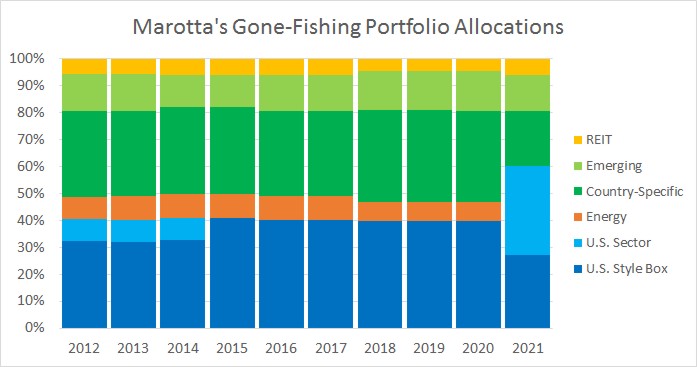
REITs are Real Estate Investment Trusts. “Emerging” is short of Emerging Markets. “Country-Specific” is our Freedom Investing allocations. “Energy” represents the Energy sector and, in earlier portfolios, all natural resources. “U.S. Sector” is targeted weights to specific domestic sectors. “U.S. Style Box” are allocations to small, mid, or large cap funds.
You can see that we have made the most significant changes this year, which you can read about in “An Overview of Marotta’s 2021 Gone-Fishing Portfolios.”
In this article, I’d like to provide a review of how our portfolios performed over the time period we’ve offered them.
To evaluate the return of the Gone-Fishing Portfolio, I used the age-20 100%-Stock portfolio from each year’s recommendation; downloaded each fund’s return data from Morningstar from January 1, 2012 through December 31, 2021; allocated the model according to the portfolio’s percentages; and then let the fund allocations drift until rebalancing to the new annual recommendation in January.
This created the 2012 – 2020 return of the Historical Gone-Fishing portfolio.
I also ran the 2021 Gone-Fishing Portfolio returns over the same time period, rebalancing to the 2021 recommendations once in January. It is important to note, even though it is likely obvious, that we did not offer our 2021 Gone-Fishing Portfolio before this year, so no one could have invested in it. What is more, its historical returns over this time period don’t mean it will perform similarly in the future.
When a fund from the 2021 portfolio was not available in a given year, I substituted the old Gone-Fishing portfolio fund in its place. Those replacements were:
- iShares MSCI Australia ETF (EWA) for Franklin FTSE Australia ETF (FLAU) before 12/31/2017
- iShares MSCI Switzerland ETF (EWL) for Franklin FTSE Switzerland ETF (FLSW) before 3/31/2018
- iShares MSCI Canada ETF (EWC) for iShares MSCI Denmark ETF (EDEN) before 2/26/2012
- Vanguard S&P 500 ETF (VOO) for SPDR® MSCI USA StrategicFactors ETF (Market Return) before 5/31/2015
- iShares MSCI United Kingdom ETF (EWU) for SPDR® Solactive United Kingdom ETF (ZGBR) before 7/31/2014
After creating these two versions of the Gone-Fishing Portfolio, I then compared them to U.S. stocks as represented by Vanguard Total Stock Market ETF (VTI), global stocks as represented by iShares MSCI ACWI ETF (ACWI), and foreign stocks as represented by iShares MSCI ACWI ex US ETF (ACWX).
Return Comparison
Here is the growth of $10,000 under those various portfolios:
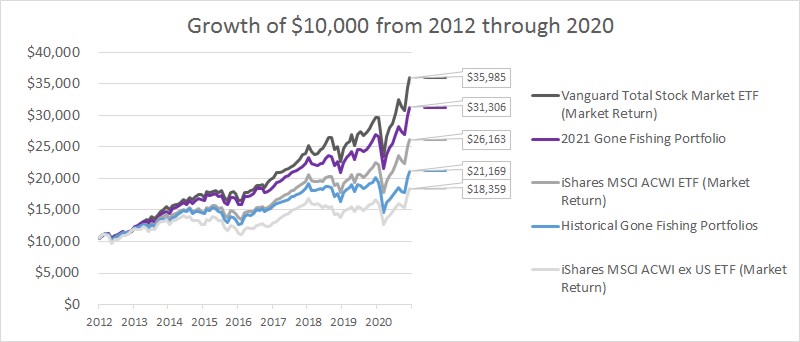
Over this short 8-year time period, U.S. stocks had the best return while foreign stocks had the worst. Global stocks, because it is a blend of 58% U.S. and 42% foreign, had returns near the middle.
Our historical Gone-Fishing Portfolios underperformed global stocks. Part of that poor performance was thanks to our larger tilt towards foreign stocks. Part was thanks to our Energy allocation. From January 2012 through December 2020, Vanguard Energy ETF (VDE) saw a -4.46% return and iShares North American Natural Res ETF (IGE), our original fund, saw a -2.82% return. Even though Energy was a great portfolio addition historically, Energy has fallen off of the efficient frontier in recent times. With our recent frontier analysis, we feel we have more data to justify a Consumer Staples, Technology, and Healthcare overweight than we do an Energy one.
Our 2021 Gone-Fishing Portfolio was not available for investing during this time period, but if it had been, you can see that it would have performed better than our Historical Gone-Fishing Portfolio. The smaller foreign stock allocation and removal of Energy both would have helped over this time period. We hope that our new portfolio sees improvement for the next 9-years, but past performance is no indication of future returns. While we believe we have the data to justify our changes, they may not actually offer an advantage going forward.
Risk Comparison
When looking at the coefficient of variation (COV) for each of these portfolios, you can see how much risk you had to tolerate to get one more unit of return. COV is calculated by dividing the standard deviation by the annual return. As such, the lowest COV would be the best risk-adjusted return while the highest is the least risk-adjusted return. Here is what the COV is for those five portfolios:
| Portfolio | Vanguard Total Stock Market ETF (VTI) | 2021 Gone-Fishing Portfolio | iShares MSCI ACWI ETF (ACWI) | Historical Gone-Fishing Portfolio | iShares MSCI ACWI ex US ETF (ACWX) |
|---|---|---|---|---|---|
| Annual Return | 15.29% | 13.52% | 11.28% | 8.69% | 6.98% |
| Standard Deviation | 3.99% | 3.66% | 3.87% | 4.20% | 4.12% |
| COV | 0.26 | 0.27 | 0.34 | 0.48 | 0.59 |
You can see that the 2021 Gone-Fishing Portfolio, while having a lower return than VTI, has a similar risk-adjusted return thanks to its lower volatility. Also, you can see that our Historical Gone-Fishing Portfolio suffered under higher volatility than we would have hoped when compared to ACWI, but both its returns and COV are very respectable.
United States Comparison
Using only the U.S. Stock Allocations of Large Cap, Mid Cap, Small Cap, Technology, Health Care, and Consumer Staples, I created a U.S. Only version of each Gone-Fishing portfolio and compared those to the three comparison ETFs.
Here is the growth of $10,000 using only those U.S. Stock sectors:
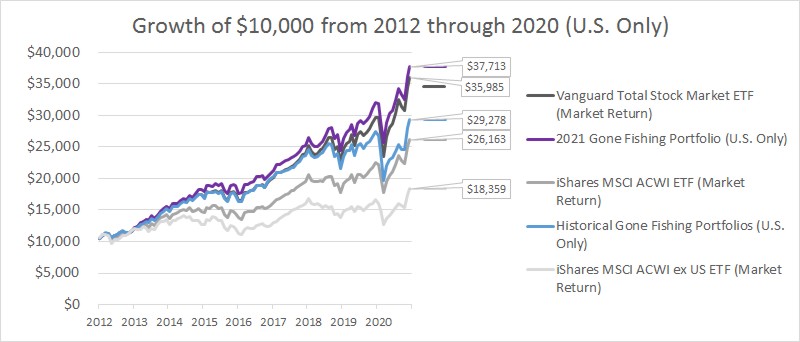
You can see here that our Historical Gone-Fishing Portfolios underperformed the Vanguard Total Stock Market. This is likely because we tilt towards Value, and the past few years have been a season of growth.
You can also see that our new 2021 Gone-Fishing Portfolio, even though it still has a Value tilt, would have had a slight advantage over VTI, likely thanks to its new sector allocations. You can read more about our choice to emphasize these sectors in “We Added 2 New U.S. Stock Sectors to Our Allocations.”
Foreign Comparison
Using only the Foreign Stock Allocations of our country-specific ETFs and emerging market funds, I created a Foreign Only version of each Gone-Fishing portfolio and compared those to the three comparison ETFs.
Here is the growth of $10,000 using only those Foreign Stock sectors:
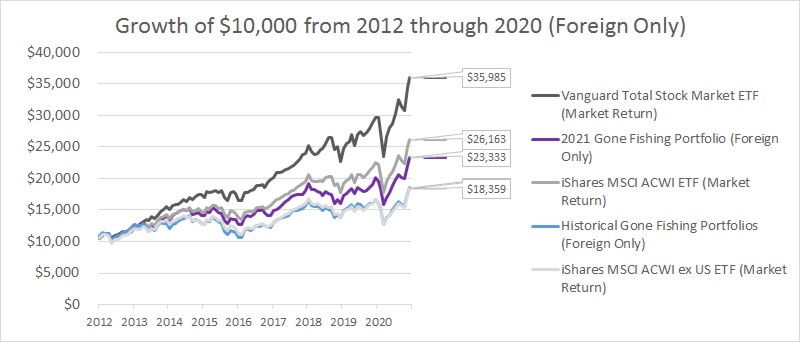
You can see how the foreign allocation of our Historical Gone-Fishing Portfolios performed very similarly to foreign stocks as a whole, and our new 2021 Gone-Fishing Portfolio, with its sector tilting away from Financials and towards Healthcare, would have had a slight advantage.
Vanguard FTSE Emerging Markets ETF (VWO) underperformed foreign overall over the time period with an annual return of 5.85% compared to the 11.28% return of iShares MSCI ACWI ETF (ACWI).
When you look at just the Freedom Investing country-specific allocations, you can see more of the story:
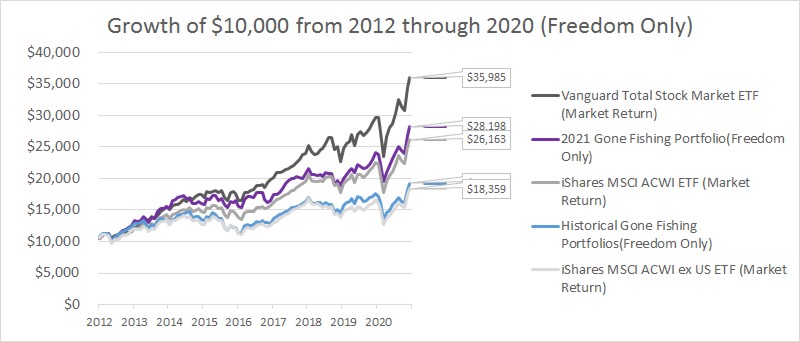
Here you can see how the country-specific funds of Freedom Investing performed slightly better than foreign overall in our Historical Gone-Fishing Portfolio. Furthermore, you can see how the new sector tilts would have offered an even greater advantage over the time period had we implemented them sooner.
Conclusions
Overall this unfortunately means that our Historical Gone-Fishing Portfolio underperformed its benchmark of ACWI. In retrospect, IGE, our original Resource Stock allocation, would have been better to keep than VDE, but removing Energy earlier and quicker would have been even better.
While this season has been sluggish for both Value and Foreign, you can see from these graphs that the return, even when its tilts are not winning, is still respectable. Investing $10,000 at the start of January 2012 could have grown to $21,169 with our Gone-Fishing Portfolio recommendations. This is a 8.69% annualized return.
We are very pleased to provide this service to our readers and hope our annual changes serve the portfolio well in the future.
Photo by Tholaal Mohamed on Unsplash