 A gone-fishing portfolio is a portfolio of just a few stocks which should weather the ups and downs of the market fairly well while only rebalancing twice a year. We recommend a gone-fishing portfolio for people who are just getting started with investing. For people with more invested assets or who are in or near retirement, we recommend professional management. For that reason, our calculators do not make recommendations beyond age 70.
Our standard gone-fishing portfolio can be used at any custodian.
In the past, we have made several custodian-specific portfolios in order to take advantage of each custodian’s specific no-transaction-fee list. However late in 2019, several custodians switched to have no transaction fees for exchange-traded funds (ETFs). This eliminates the need for custodian-specific portfolios for Charles Schwab, TD Ameritrade, Fidelity, eTrade, and others.
As a result, our standard portfolio is the best recommendation at most custodians for 2020.
We also still have some custodian-specific portfolios for the custodians which still have a limited no-transaction-fee list. As of the writing of this article, the only custodian-specific portfolio we have crafted for 2020 is Vanguard. However, if you’d like us to create one for your custodian, you can send us your request through our Contact page.
If you are just getting started with investing and have not yet selected a custodian, in the past we would normally recommend Vanguard because of their no-transaction-fees on Vanguard mutual funds and no account minimums. However, Charles Schwab now has no-transaction-fees for U.S. security trades and has also moved to allowing account opens with no minimum deposit.
For these reasons, we would now recommend selecting Charles Schwab as your custodian and using the Default gone-fishing portfolio.
For those still interested in an all-mutual fund portfolio at Vanguard, we have updated the Marotta’s Vanguard Gone-Fishing Portfolio for 2020.
Here are all of our gone-fishing portfolios so-far for 2020:

Marotta’s 2020 Gone-Fishing Portfolio Calculator
This gone-fishing portfolio is our default portfolio which can be used at any custodian.

Marotta’s 2020 Vanguard Gone-Fishing Portfolio Calculator
We recommend this gone fishing portfolio for accounts hosted at Vanguard.
A Review of 2019 Returns
Each year, we use the Age 40 Asset Allocation (85.4% stocks and 14.6% bonds) for performance comparison.
During 2019, our gone-fishing portfolios had a return of:
- 22.14% for the 2019 Schwab portfolio (Expense ratio of 0.19%)
- 21.57% for the 2019 Vanguard portfolio (Expense ratio of 0.20%)
- 21.37% for the 2019 TD Ameritrade portfolio (Expense ratio of 0.27%)
- 21.26% for the 2019 Default portfolio (Expense ratio of 0.17%)
- 20.80% for the 2019 eTrade portfolio (Expense ratio of 0.15%)
- 20.38% for the 2019 Fidelity portfolio (Expense ratio of 0.22%)
If our newly created 2020 Marotta’s Gone-Fishing Default Portfolio had been around for 2019, it would have had a return of 22.05% and an expense ratio of 0.16%.
It is normal that different implementations of similar investment strategies have returns that vary across a 1.76% range. Differences in the funds that are selected produce random discrepancies in each return for the year. Additionally, we purposefully limit the number of positions we allow in a gone-fishing portfolio. If one custodian doesn’t have some low-cost fund selections, we may include other categories useful in portfolio construction. Those differences account for the slight variability between the portfolios. These differences have nothing to do with which custodian is best. During 2018, the custodian-specific portfolios had a completely different ordering.
For comparison, here are the 2019 returns for various indices:
- 31.49% for the all-stock S&P 500 Index
- 22.72% for the more appropriate 15% Stability / 85% Appreciation benchmark
- 27.30% for the MSCI All Country World Index
Our Default portfolio under performed the blended stability/appreciation index by about 1.46%.
Energy Stocks
Asset allocation means you always have something to complain about. The worst performing asset category this year was Energy as represented in the Default portfolio by Vanguard Energy ETF (VDE) with a market return of 9.27%. That is a great return for the year, but much lower than other equities and did not make up for 2018’s negative return of -19.96%.
Low energy prices pulled down the returns of all of the portfolios with Energy funds. The TD Ameritrade portfolio used SPDR S&P Global Natural Resources ETF (GNR) with a higher 16.45% return on account of being 33% energy and 61% materials. We added GNR to the TD Ameritrade portfolio in 2019 when they changed the list of no-transaction-fee securities to include a resource stock fund.
There are reasons to remove a sector from your asset allocation but not simply for returns that are below average.
U.S. Stocks
The S&P 500 Index had a return of 31.49%. Meanwhile, U.S. Large Cap holdings in the Marotta Gone-Fishing Portfolios were:
- 32.44% for SPDR MSCI USA StrategicFactors ETF (QUS) [Schwab, TD Ameritrade, 2020 Default]
- 31.35% for Vanguard S&P 500 ETF (VOO) [2019 Default, Vanguard]
- 31.25% for iShares Core S&P 500 ETF (IVV) [Fidelity Portfolio]
- 28.19% for Global X Scientific Beta US ETF (SCIU) [eTrade]
Both VOO and QUS are on our Investment Committee’s current Marotta Buy List for client accounts. We prefer using QUS as we believe that its factor approach will boost returns in the long term. It performed 1.09% better than VOO in 2019, but this alone is no indication of future returns. The factors it uses (value, low volatility, and quality) are what should boost returns over long periods of time. As a result, we have decided to use QUS for the 2020 Default portfolio.
In addition to U.S. Large Cap, we also have allocations to Mid-Cap Value and Small Cap Value. Those holdings were:
- 27.84% for Vanguard Mid-Cap Value ETF (VOE) [2019 Default, Vanguard, 2020 Default]
- 25.89% for SPDR S&P 400 Mid Cap Value ETF (MDYV) [Schwab, TD Ameritrade]
- 25.67% for iShares S&P Mid-Cap 400 Value ETF (IJJ) [Fidelity]
- 24.26% for SPDR S&P 600 Small Cap Value ETF (SLYV) [Schwab, TD Ameritrade, 2020 Default]
- 24.12% for iShares S&P Small-Cap 600 Value ETF (IJS) [Fidelty]
- 22.76% for Vanguard Small-Cap Value ETF (VBR) [Default, Vanguard, eTrade]
All of these ETFs under performed the S&P 500 Index’s return of 31.49%. This is part of the 12-year trend of growth stocks out performing value stocks which we wrote about at the end of July, 2019 in “Value Investing During Seasons of Growth.”
Here are the returns broken down by style box according to Morningstar:
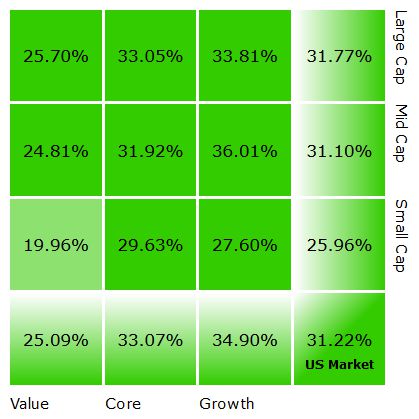
The best performing Mid-Cap Value ETF amongst the Marotta’s Gone-Fishing Portfolios was VOE, probably because when you compare all the funds it has the largest component of large cap.
The best performing Small Cap Value ETF amongst the Marotta’s Gone-Fishing Portfolios was SLYV, probably because the S&P 600 Value Index has a different mix of stocks than what Vanguard has and that mix performed better this quarter.
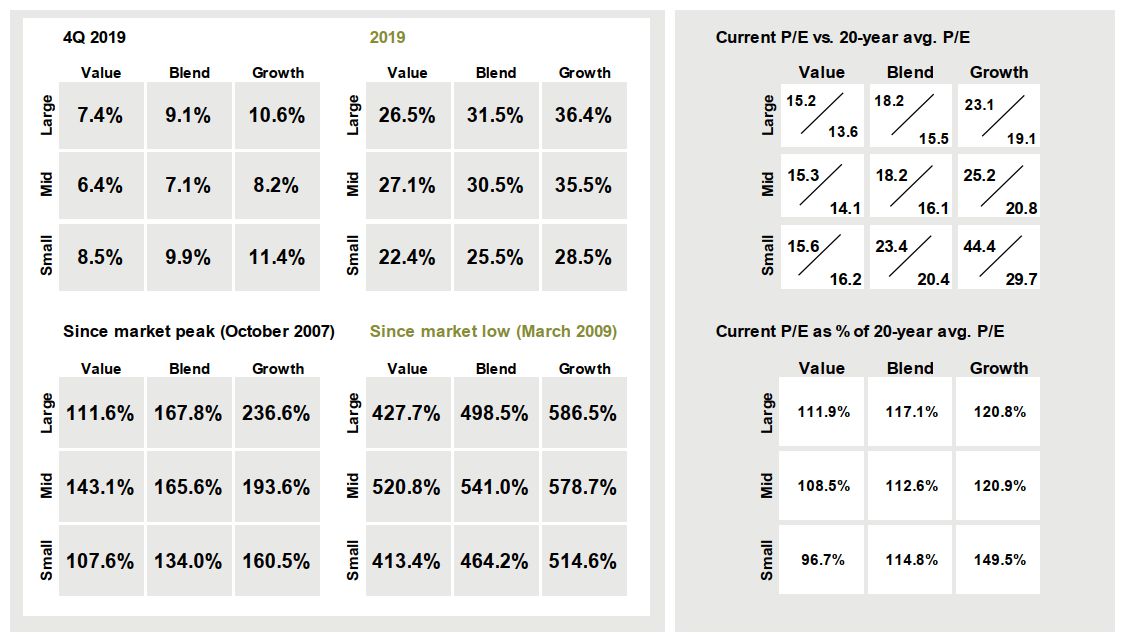
As we suggested in our July article, “Now that Growth investments have appreciated so much more than Value, forward P/E ratios are starting to suggest that Growth investments are comparatively more expensive. Dynamic tilt is starting to recommend tilting away from Growth again and back towards Value.”
Here is the latest chart from J.P. Morgan’s most recent quarterly Guide to the Markets showing both the superior performance of Growth (see how the Large, Mid, and Small Growth returns are large compared to the remaining six boxes for each time period) and the relatively inexpensive historical valuation of Small Cap Value (see how the “Current P/E as % of 20-year avg. P/E” for Small Value is less than 100%).
Thinking that SLYV has a better mix of smaller stocks, we have decided to use a mix of both VOE and SLYV for the Default portfolio in 2020.
Foreign Developed Stocks
Europe, Australasia, and the Far East (EAFE)
Vanguard does not have no-transaction-fee country-specific funds. Thus, its portfolio along with the 2019 eTrade portfolio simply had to invest in the EAFE Index to gain exposure to foreign stocks.
The MSCI EAFE Index had a return of 22.01% for 2019. Meanwhile portfolios based on the EAFE Index performed close to the index:
- 21.96% Vanguard Developed Markets Index Fund Inv/Adm (VDVIX/VTMGX) [Vanguard]
- 22.62% Vanguard FTSE Developed Markets ETF (VEA) [eTrade]
Freedom Investing
The other portfolios had some blend of countries with economic freedom according to our Freedom Investing strategy.
Here are the country specific returns for 2019
- 31.66% Franklin FTSE Switzerland ETF (FLSW) [2020 Default]
- 31.58% iShares MSCI Switzerland ETF (EWL) [2019 Default, TD Ameritrade, Fidelity]
- 30.10% iShares MSCI New Zealand ETF (ENZL) [2020 Default]
- 28.39% SPDR Solactive Canada ETF (ZCAN) [2019 Default, Schwab]
- 28.15% iShares MSCI Ireland ETF (EIRL) [Fidelity, 2020 Default]
- 23.34% SPDR Solactive United Kingdom ETF (ZGBR) [Schwab]
- 23.33% Franklin FTSE Australia ETF (FLAU) [2020 Default]
- 22.41% iShares MSCI Australia ETF (EWA) [2019 Default, Fidelity]
- 18.45% SPDR Solactive Germany ETF (ZDEU) [Schwab]
- 14.53% iShares MSCI Singapore ETF (EWS) [2019 Default, Fidelity, 2020 Default]
- 13.86% SPDR Solactive Hong Kong ETF (ZHOK) [2019 Default, 2020 Default]
- 10.71% iShares MSCI Hong Kong ETF (EWH) [TD Ameritrade, Fidelity]
Hong Kong, Singapore, New Zealand, Switzerland, Australia, and Ireland were ranked “Free” by the Heritage Index of Economic Freedom.
United Kingdom, Canada, and Germany are ranked just below the free category in “Mostly Free.”
Each custodian-specific portfolio had a different mix of which of these countries were available with no transaction fee. Here are the foreign developed returns based on each portfolio mix:
- 23.60% 2020 Default Portfolio
- 23.39% Schwab Portfolio
- 21.15% TD Ameritrade Portfolio
- 19.81% Fidelity Portfolio
- 19.05% 2019 Default Portfolio
The new 2020 Default Portfolio is using Hong Kong, Singapore, New Zealand, Switzerland, Australia, and Ireland which are all of the countries currently ranked “Free.” The equal-weighted average of the 2019 return of these countries was 23.59%.
In the new 2020 Default Portfolio, we are using an unequal weighting which better represents the static weightings we use in our managed accounts. This weighting is based on freedom rank and cap weighting but does not include any monthly dynamic tilt based on forward P/E ratio. The return using this unequal weighting was 23.60%. We think this will be a better mix over the long run.
Here is the unequal weighting first as a percentage of the entire 40-year-old portfolio we analyzed, and as a percentage of the developed foreign stock allocation in the last column.
| Percent of Overall Portfolio | Country | Fund | Percent of Foreign |
|---|---|---|---|
| 5.3% | Switzerland | Franklin FTSE Switzerland ETF (FLSW) | 14.0% |
| 5.3% | Australia | Franklin FTSE Australia ETF (FLAU) | 14.0% |
| 4.7% | Hong Kong | SPDR Solactive Hong Kong ETF (ZHOK) | 12.6% |
| 3.9% | Singapore | iShares MSCI Singapore ETF (EWS) | 10.4% |
| 3.6% | Ireland | iShares MSCI Ireland ETF (EIRL) | 9.5% |
| 3.6% | New Zealand | iShares MSCI New Zealand ETF (ENZL) | 9.5% |
All of the other portfolios suffered by not including all of the countries ranked in the free category.
When there is a choice, we have chosen to use ZHOK with factors in the 2020 Default portfolio instead of EWH without factors. We are also using FLSW and FLAU in the 2020 Default portfolio instead of EWL and EWH on account of the Franklin funds’ lower expense ratios.
By including all six “Free” countries, we are using half of our asset allocation slots to target “Free” countries for our investment strategy.
Emerging Market Stocks
Emerging market funds used in the Gone-Fishing Portfolios had the following 2019 returns:
- 20.76% Vanguard Emerging Markets ETF (VWO) [2019 Default, eTrade, 2020 Default]
- 20.27% Schwab Emerging Markets Equity ETF (SCHE) [Schwab]
- 20.13% Vanguard Emerging Markets Stock Index Inv/Adm (VEIEX/VEMAX) [Vanguard]
- 17.79% iShares Core MSCI Emerging Markets ETF (IEMG) [Fidelity]
- 15.38% SPDR MSCI Emerging Markets StrategicFactors ETF (QEMM) [TD Ameritrade]
For 2020, we are not changing our Default portfolio selection of VWO. We have been watching QEMM to see if the strategic factors would boost returns. We have selected SPDR’s strategic-factor-country-specific funds for Hong Kong, United Kingdom, Canada, and Germany. Those factors may very well boost returns going forward for emerging markets, but in 2019 they under performed by 5.38%.
Real Estate Investment Trusts (REITs)
Real estate funds used in the Gone-Fishing Portfolios had the following 2019 returns:
- 28.87% Vanguard Real Estate ETF (VNQ) [2019 Default, 2020 Default]
- 28.79% Fidelity MSCI Real Estate Index ETF (FREL) [Fidelity]
- 27.34% Vanguard Real Estate Index Inv/Adm (VGSNX/VGSLX) [Vanguard]
- 25.96% iShares Core US REIT ETF (USRT) [TD Ameritrade]
- 24.39% iShares Global REIT ETF (REET) [eTrade]
- 22.89% Schwab U.S. REIT ETF (SCHH) [Schwab]
For 2020, we are not changing our Default portfolio selection of VNQ.
U.S. Bonds
U.S. bond funds used in the Gone-Fishing Portfolios had the following 2019 returns:
- 11.76% WisdomTree Barclays Yield Enhanced US Aggregate Bond ETF (AGGY) [TD Ameritrade]
- 9.13% iShares Core Total USD Bond Market ETF (IUSB) [eTrade]
- 8.64% Schwab U.S. Aggregate Bond ETF (SCHZ) [2019 Default, Schwab, 2020 Default]
- 8.46% iShares Core U.S. Aggregate Bond ETF (AGG) [Fidelity]
- 7.54% Vanguard Total Bond Market Index Fund Inv/Adm (VBMFX/VBTLX) [Vanguard]
For 2020, we are not changing our Default portfolio selection of SCHZ.
Foreign Bonds
Foreign bond funds used in the Gone-Fishing Portfolios had the following 2019 returns:
- 17.79% iShares Core International Aggregate Bond ETF (IAGG) [Fidelity]
- 17.65% Invesco Emerging Markets Sovereign Debt Portfolio (PCY) [Schwab]
- 15.48% iShares JP Morgan USD Emerging Markets Bond (EMB) [TD Ameritrade]
- 14.46% Vanguard Emerging Markets Government Bond ETF (VWOB) [2019 Default, 2020 Default]
- 13.42% WisdomTree Emerging Markets Corp Bd ETF (EMCB) [eTrade]
- 12.04% Vanguard Emerging Markets Government Bond Inv/Adm (VGOVX/VGAVX) [Vanguard]
For 2020, we are not changing our Default portfolio selection of VWOB.
Reminder: Stay the Course
We have a saying, “It is always a good time to have a balanced portfolio.” While we almost had a Bear Market in 2018 followed by the longest economic expansion in 2019, we believe volatile markets are the times when it is most important to stay invested.
It is easy to get out of the markets when they look risky. They may always look risky, but it is difficult to know when to get back in.
We believe that it is always better to be invested in the markets than trying to time the markets.
Photo by Oskars Sylwan on Unsplash
Latest posts from David John Marotta
- How To Distribute from A College America 529 Plan to an Account Owner - October 22, 2024
- #TBT Are Democrats Or Republicans Better For The Stock Market? - October 17, 2024
- How To Distribute from A College America 529 Plan to a Designated Beneficiary - October 15, 2024