 In our article “Revisiting BRIC Countries 10 Years Later” we concluded:
While the emerging markets as a whole have not had the best decade of returns, historically this is a good category for a portion of your portfolio. Additionally we believe that the emerging markets as a whole currently have a favorable forward price to earnings ratio.
The latest decade of returns has caused the emerging markets to under perform the S&P 500 over the past 30 years.
During the 30 years ending 6/3/2018 the annual return of the S&P 500 TR Index has been 10.35% verses the MSCI EM GTR Index’s return of 9.95%. Meanwhile, the average annual standard deviation (a measurement of risk) for each index has been 14.66% for the S&P 500 and 21.82% for the emerging markets. This risk and return profile leads us to ask this question:
If emerging markets has had a lower return and higher volatility than the S&P 500, should my asset allocation include the emerging markets?
The short answer is yes, it should include the emerging markets even if we were certain that it would under perform over the next 30 years. The simplistic understanding of putting everything in what you expect to go up the most ignores the rebalancing bonus available to non-correlated allocations.
Over the past three decades, the correlation between the S&P 500 and emerging markets has been a low 0.53. Low correlation between volatile assets produces the biggest rebalancing bonus.
Here is a chart showing the risk and return curve of blended portfolios comprised of various percentages of allocations between the S&P 500 and the emerging markets.
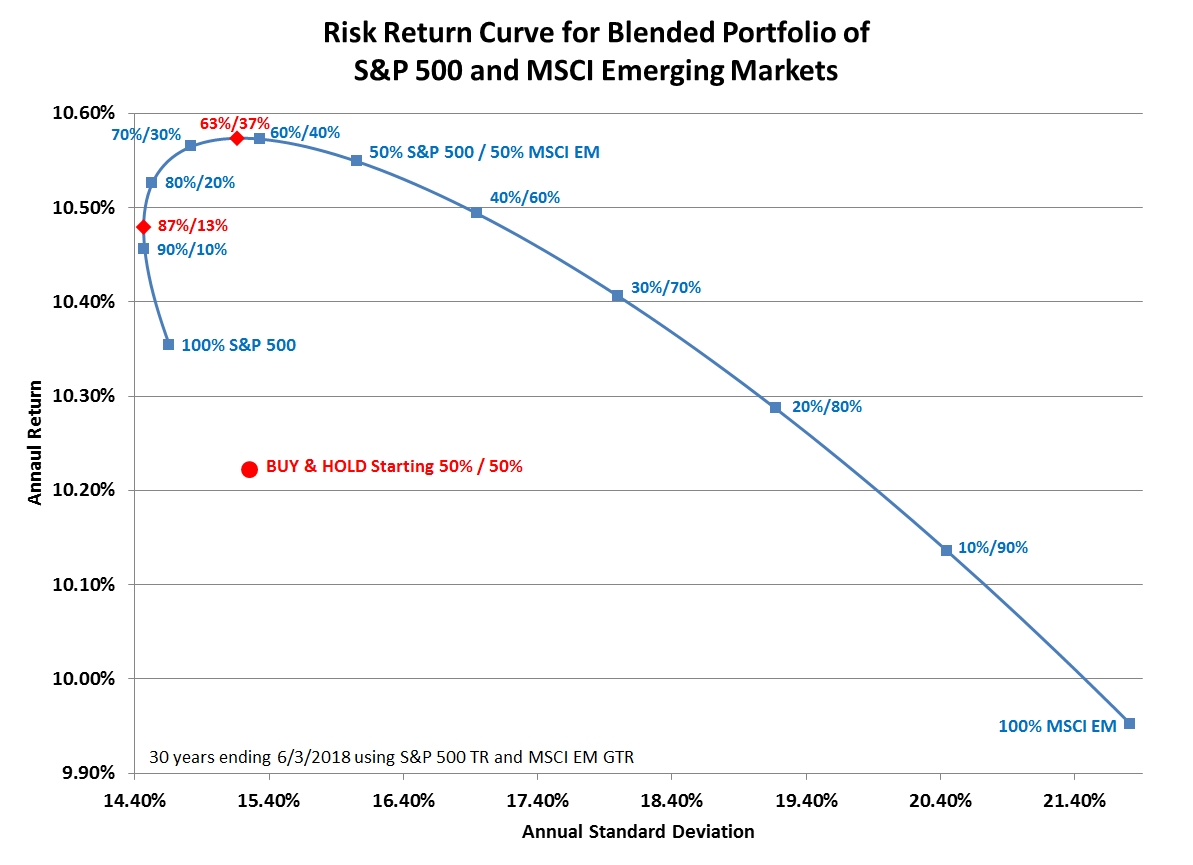
The efficient frontier is composed of investments with the highest return and the lowest volatility. When talking about asset allocations, the efficient frontier are the asset allocations which provide the best return for the smallest risk.
The efficient frontier of the S&P 500 and emerging markets has its edges depicted as the red triangles and is portfolios between 13% and 37% emerging markets.
The blended portfolio with the lowest volatility was a portfolio of 87% S&P 500 and 13% emerging markets. This portfolio had an annual volatility of just 14.47% and a mean return of 10.48% (0.13% higher than a portfolio of 100% S&P 500).
The blended portfolio with the highest mean return was a portfolio of 63% S&P 500 and 37% emerging markets. This portfolio had a mean return of 10.57% which is 0.22% higher than a portfolio of 100% S&P 500.
This 63%/37% allocation follows my rule of thumb. Having analyzed hundreds of risk-return curves, I observed that when you are not sure how to allocate two stock components put one third into the category with the higher expected return and volatility and two-thirds into the more stable category.
Even though emerging markets under performed the S&P 500, portfolios with up to 75% in emerging markets had a higher return than a 100% S&P 500 portfolio.
As we start the next 30 years, we may wish that we knew which of these two indexes were going to perform better. If we knew which index was going to perform better, we would be tempted to put our entire portfolio in that index. But this would be a mistake.
As we can see from the past 30 years, nearly any blended portfolio did better than trying to pick a winner without rebalancing. Even if you knew which category would perform the best, hedging your bets, blending an allocation, and regularly rebalancing did even better. That’s the power of the rebalancing bonus.
Given all this data, how large was the rebalancing bonus between these two indexes?
My method of measuring the bonus is to look at the returns of a 50%/50% portfolio both with and without rebalancing.
Had you started by buying an allocation of 50% S&P 500 and 50% emerging markets and then never rebalanced your buy and hold strategy would have had a return of 10.22% and a standard deviation of 15.26%. At the end of 30 years, your asset allocation would have grown out of balance ending with an asset allocation of 68.73% S&P 500 and 31.27% emerging markets.
Meanwhile, if you had diligently rebalanced your portfolio back to a 50%/50% asset allocation, your portfolio would have had an annualized return of 10.55%, out performing the non-rebalanced portfolio by 0.33%.
Also, an initial asset allocation of 68% S&P 500 and 32% emerging markets which was regularly rebalanced would have experienced a 10.57% annualized return, again out performing the buy and hold 50%/50% strategy by 0.35%.
Therefore, I would say that the rebalancing bonus over the past 30 years was somewhere between 0.33% and 0.35%.
While emerging markets under performed the S&P 500 over the past 30 years, there are decades when emerging markets performs better than the S&P500. Here is a chart showing the 10-year rolling average annual returns of both the S&P 500 and the MSCI EM GTR indexes.
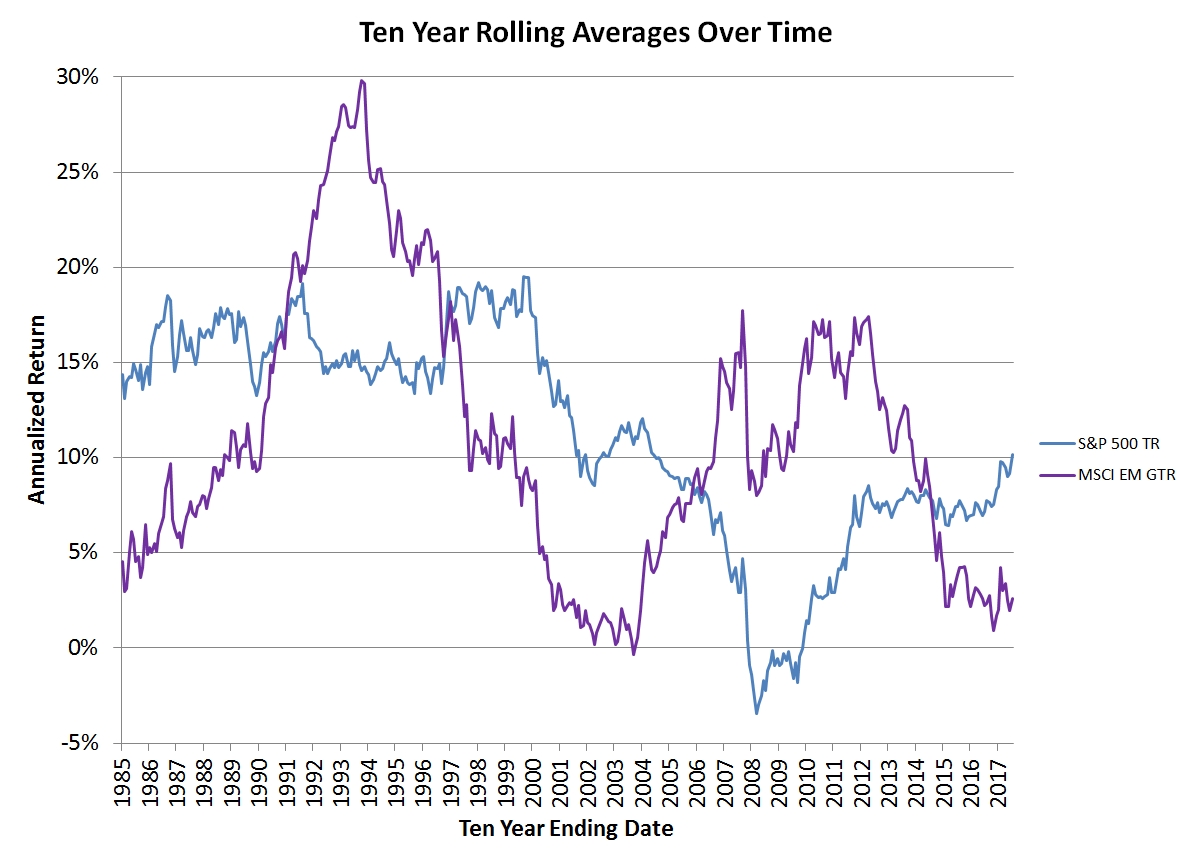
You can see from this graph that there is a lot of volatility in even 10-year emerging market returns, making the starting and ending dates of even semi-long-term measurements able to change the results. You can also see how these two indexes perform differently with the best example being during our 2008 financial crisis.
Since we don’t know which of these indexes will perform better over the next decade, I suggest blending both into your asset allocation.
Photo by Slava Bowman on Unsplash
Latest posts from David John Marotta
- #TBT A Review of Finances at Age 60 - July 25, 2024
- #TBT Implement the Automatic Millionaire at Schwab - July 18, 2024
- #TBT Stress Is Not Your Enemy - June 27, 2024