 Investors usually use short time periods and common indexes to measure performance. Twelve month (1-Year) performance returns during 2019 depended on the start date as much as the ending date.
On September 20, 2018 the S&P 500 reached a relative high. From that date to December 24, 2018 the S&P 500 Price Index dropped -19.78%, just shy of the -20% required to be defined as a Bear Market. Many pundits suggested this was just the beginning of a major correction for the U.S. stock market. An inverted yield curve gave them more ammunition to suggest getting out of the markets. My advice at the time was to stay invested and diversified. In retrospect, it was good advice.
By September 2019, the year to date returns had proven those predicting a dire market correction wrong. Here are the first 9 months of the beginning of 2019:
Year to date returns ending September 30, 2019

For consistency’s sake, we use these six exchange-traded funds (ETFs) as examples for the six different asset classes because they have average expense ratios and and follow indexes typical to the category. Having said that, no single investment represents the complexity of an entire category and will often under or over perform other investments within the asset class.
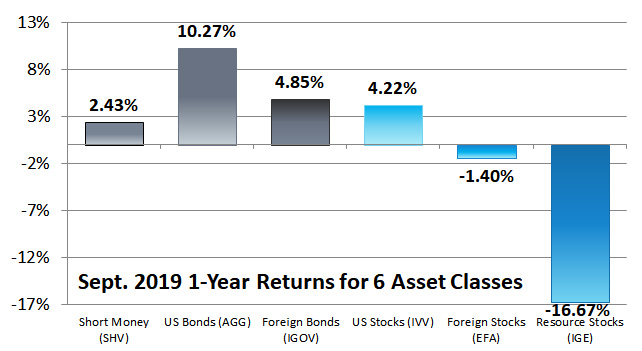
While the year to date returns were wonderful, the 12-month returns showed that much of the gains simply erased the losses from 2018. Here are the 12-month returns ending 9/30/2019:
1-Year Returns from September 30, 2018 through September 30, 2019
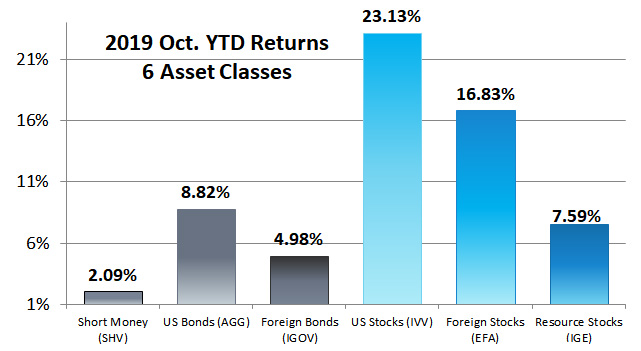
From the end of September through the end of the year, each 12-month return looked better than the previous month for two reasons. First, markets were appreciating through the end of 2019 so each month we were adding a positive month into the 12-month returns. But more significantly, we were removing a negative month at the end of 2018 from the 12-month returns by changing the starting date of the 12-month return to a month later. Here, for example, is the year to date returns for the 10 months ending 10/31/2019:
Year to date returns ending October 31, 2019
While here are the 12-month returns ending 10/31/2019:
1-Year returns ending October 31, 2019
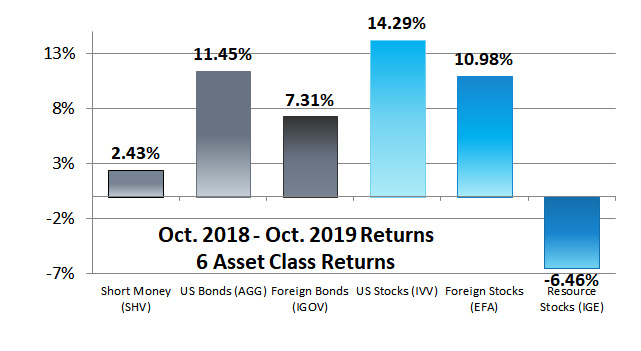
They differ so significantly on whether you include or exclude the negative months of September 2018.
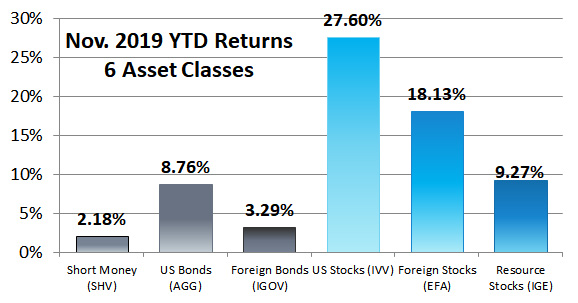
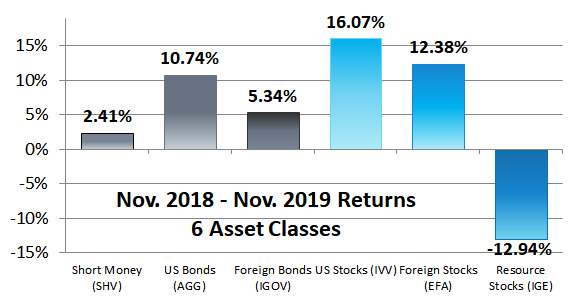
Here are the year to date returns of the 11 months ending in November:
Year to date returns ending November 30, 2019
And more significantly, here are the 12-month returns:
1-Year returns November 30, 2018 – November 30, 2019
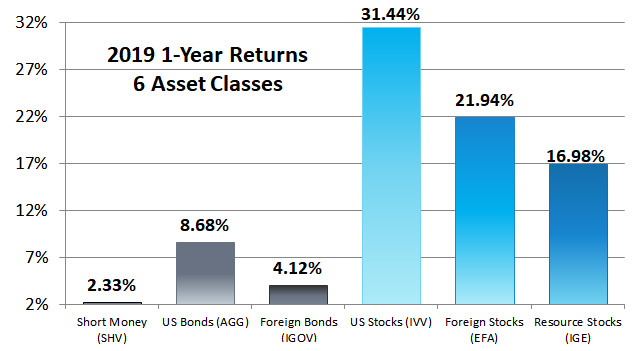
A great amount of the losses of 2018 happened in December of 2018. Here are the final returns for 2019. These are both the year to date and the 12-month returns ending 12/31/2019:
2019 returns ending December 31, 2019
These were different returns for each category than you might have experienced.
The index used for U.S. Bonds is iShares Core U.S. Aggregate Bond ETF (AGG). This index is too aggressive if you, like us, keep your bond allocation safe. Safer bonds would have had a return well under this particular index. On the other hand, if you invest in high-yield bonds, sometimes called junk bonds, you probably had a bond return much higher than 8.68%. It is difficult to know what index to compare high-yield bonds against. We would suggest that they act more like stocks, and if you want to take that amount of risk, you might as well invest in stocks because they will have a better return.
The foreign bond selections of our Marotta Gone-Fishing Portfolios all performed much better than iShares International Treasury Bond ETF (IGOV).
The 31.44% of iShares Core S&P 500 ETF (IVV) was a result of U.S. Large Cap Growth and specifically Technology of performing the best among U.S. stocks.
Here are the year to date returns from 2019 ending 12/31/2019 for U.S. markets:
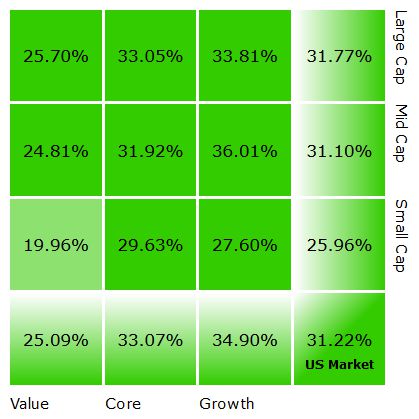
Any diversified U.S. stocks which included small cap or value had a lower return.
Foreign stocks such as iShares MSCI EAFE ETF (EFA) performed well. Emerging markets, not included in our graphs, performed well, but not as well with iShares Core MSCI Emerging Markets ETF (IEMG) having a return of 17.79%.
The stock used to represent Resource Stocks, iShares North American Natural Res ETF (IGE), also had a nice return. While Energy stocks such as Vanguard Energy ETF (VDE) had a return of just 9.27%.
Photo by Carrie Stary on Unsplash
Latest posts from David John Marotta
- How To Distribute from A College America 529 Plan to an Account Owner - October 22, 2024
- #TBT Are Democrats Or Republicans Better For The Stock Market? - October 17, 2024
- How To Distribute from A College America 529 Plan to a Designated Beneficiary - October 15, 2024