 Economists and less reliable pundits have been predicting a recession or major correction in the stock market for several years now.
In 1966, Paul Samuelson, the first American economist to win the Nobel Prize in Economics, was quoted as saying, “The stock market has forecast nine of the last five recessions.” Since then this joke has been generalized as, “Did you know economists have predicted nine of the last five recessions?”
Recessions are difficult to predict. A recession is officially defined as when the Gross Domestic Product (GDP) growth is negative for two or more consecutive quarters. Sometimes a recession is only recognized in retrospect. Recessions are common in the United States. Therefore predictions that hedge the date of a coming recession by putting it a few years in the future are very likely to be technically correct because of the random arrival rate of a recession. Between 1929 and 2008, the United States had 14 recessions, which is a recession every 5.6 years. Even if you could have anticipated every recession, jumping out of the markets every 5.6 years would have been a disastrous investment strategy.
A leading indicator is any measurement that changes before the rest of the economy begins to go in a particular direction.
Many investors try to use Gross Domestic Product (GDP) or even GDP growth as a leading indicator of stock market returns. Under this theory, changes in GDP or the rate of GDP growth precede stock markets moving the same way. This is usually not the case. In fact, the reverse is often true, where the stock market is a leading indicator of GDP.
There is nothing magical about the components of GDP. Some would argue that the inclusion of government spending allows the government to manipulate GDP growth simply by increasing government spending. Over the last three years, government spending as a component of GDP has dropped from 17.5% to 17.1%.
Recently, we have had an increasingly flat or inverted yield curve for U.S. Treasury bonds. An inverted yield curve has accompanied many recessions. This has caused articles to be written with headlines such as, “The Single Most Reliable Recession Indicator of the Past 50 Years Has Officially Started Blaring.” Such click-bait is very effective at attracting views.
An inverted yield curve is when the interest rate of short-term Treasury bonds is higher than the interest rate for longer-term Treasury bonds. Daily Treasure Yield Curve Rates can be found on the U.S. Treasury Department website. Currently, the 3-month yield is 2.26% and the 10-year yield is 2.05%. This means that it is more profitable, you are paid a higher interest rate, to hold shorter-term bonds than longer-term bonds.
Dimensional Funds offers a nice quarterly market review. We use many of their slides in our quarterly mailing. Here is an image from one of the slides that we do not use showing the current inverted yield curve:
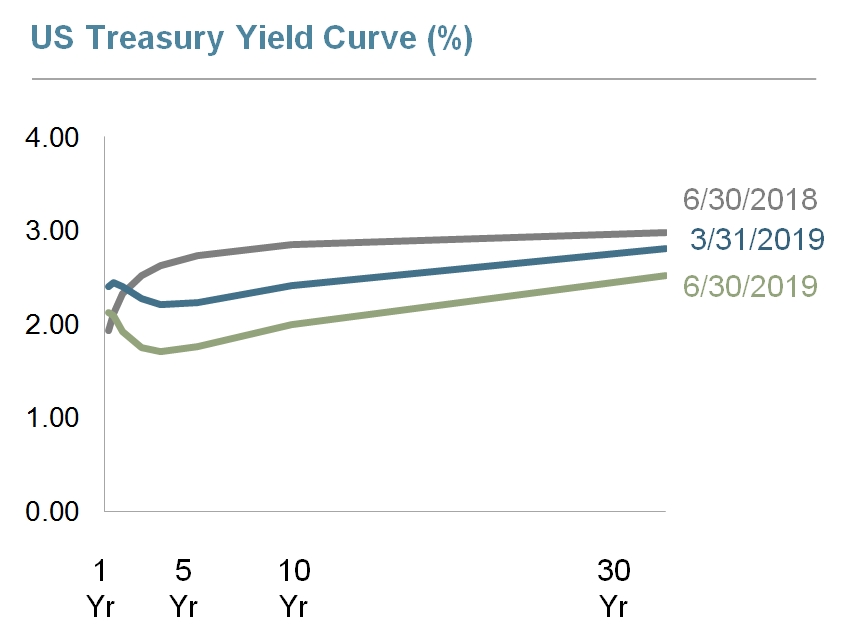
The little downturn at the beginning of the green-grey 6/30/2019 line is what has supposedly been “blaring a coming recession” for an entire quarter.
To be clear, I am not predicting we won’t have a recession in the next 5.6 years. Statistically, that would be foolishness. Neither am I predicting we won’t have a market correction. The market is inherently volatile. Corrections and Bear Markets are common occurrences.
But I am suggesting that this dip in the yield curve does not cause or necessarily predict a recession. Why, then, do so many pundits pounce on an inverted yield curve as a sign of the coming financial apocalypse?
First, it is important to note that predicting evidence of some imminent financial doomsday is the best method to attract attention. It doesn’t even matter if your prediction comes true or not.
Second, even the conventional thinking behind an inverted yield curve’s predictive powers is complex. Normally, bond investors are paid more for their willingness to tie up their money for longer periods of time. Bond market pricing, however, is not perfect.
Economic indicators always remind me of sports statistics, they are true until they are not. Sports commentators love to quote predictive statistics like, “No team has ever lost after …” followed by whatever fits the current game being played. Certainly scoring quickly, taking a massive lead, and being ahead at the half are all indicators that you are the better team and will probably win. But when you start finishing that sentence with days of the week, home field advantage, and other loosely connected facts the statement begins to sound absurd.
The yield curve can invert for many reasons. At best, an inverted yield curve is just an indicator that a significant number of people have decided to bid up the price for safe secure investments.
When investors are spooked about the economy or the stock market, some will move money from stocks to longer duration bonds. This demand can push up the price and therefore push down the effective yield for longer duration bonds, inverting the yield curve. Thus, an inverted yield curve can signal weakening investor sentiment. This doesn’t necessarily cause a recession, but it can be a signal that people have a strong enough worry that either a recession or a downturn in the markets is coming to have already moved money into longer-term Treasury bonds.
It is like suggesting that people carrying umbrellas is the best indicator that it is going to rain.
Another difficulty with untangling the cause and effect is that a downturn in the market is caused by more people selling than buying. Whenever there are more sellers than buyer, market makers must buy the stock and as they do they move the market bid-ask prices down. If investors are buying long-term bonds, they are more likely to be selling stocks and pushing stock prices down.
Additionally, as people lose money in the stock market they feel less rich and spend less money. Spending currently accounts for 67.6% of GDP. Any significant prolonged contraction of spending will, by definition, result in a recession.
Many investors are fickle and willing to jump out of the markets. It is easy for an inverted yield curve to spook enough investors to cause a downturn in the markets or a recession.
Finally, there are two ways to get an inverted yield curve: Short-term interest rates can rise or long-term rates can fall.
The Federal Open Market Committee (FOMC) of the Federal Reserve sets the federal funds target rate used by banks. This rate artificially moves the interest rate of many other related short-term rates, including short-term Treasuries. Here is a chart from J.P. Morgan’s quarterly Guide to the Markets showing the FOMC’s recent raising of the federal funds target rate.
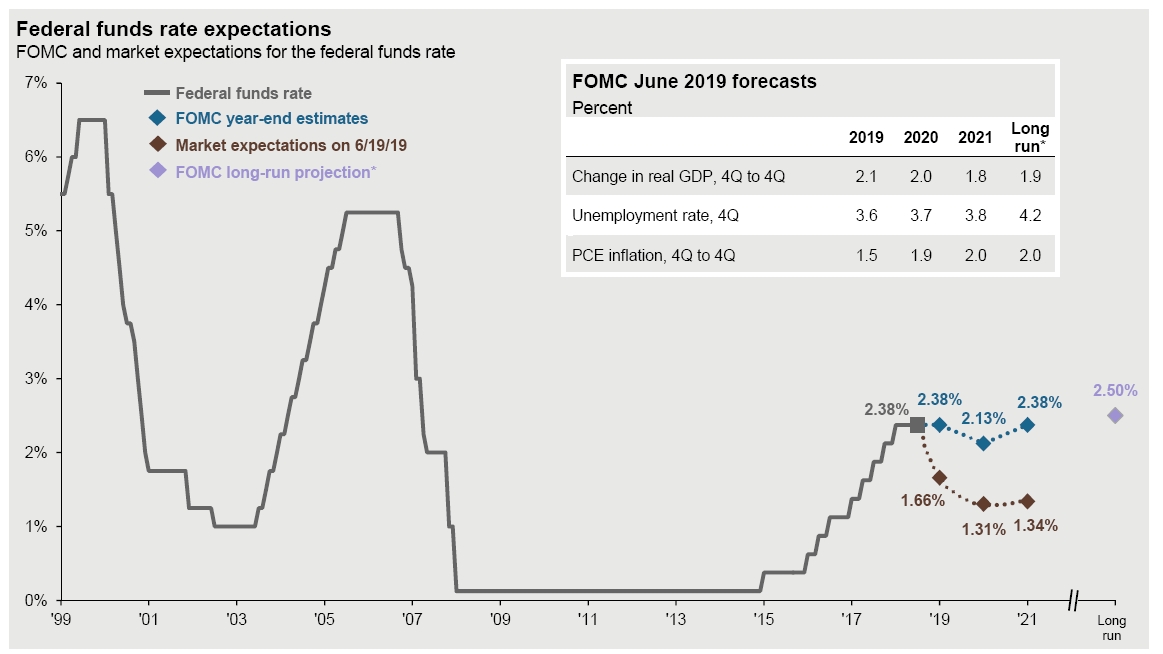
This chart explains why the short-term interest rates have risen. The rate was held extremely low during the 8 years of the Obama administration in an attempt to stimulate the economy. This rise in interest rates has been precipitous since President Trump’s election and he has complained about it. Regardless of your politics, any indicator which can be manipulated by the government should not be used as a measure of current reality, let alone a future prediction.
In addition to the federal funds rate, this chart shows you that the market expectation is that these higher short-term rates won’t hold, but will drop back to 1.34%. This is another way of thinking about what an inverted yield curve suggests. If it could talk, an inverted yield curve would explain, “Sure you can get 2.26% for the next 3 months, but in a year or two these rates are going to be back down at 1.34%. If you want 2.05% for the long term you should buy 10-year Treasuries. That’s the best you can get for the long term.”
As always, we recommend that investors remain calm and rebalance. Rebalancing is nearly always a better solution than panicking.
Photo used under the Free Fancycrave License.
Latest posts from David John Marotta
- How To Distribute from A College America 529 Plan to an Account Owner - October 22, 2024
- #TBT Are Democrats Or Republicans Better For The Stock Market? - October 17, 2024
- How To Distribute from A College America 529 Plan to a Designated Beneficiary - October 15, 2024