 A Richmond investment management company mentioned at a dinner hosted for prospective clients that they were going to be getting out of stocks entirely and going to cash in October in anticipation of the presidential general election. Recommendations to get out of the markets and go to cash are frequently made by investment managers. Every study suggests trying to time jumping out of the markets is a losing venture and yet predictions of dire market crashes perennially attract more media attention than they deserve.
Let me start by suggesting that there is insufficient data to find any trends regarding election years. You should ignore every article that provides a chart detailing what the stock market “does” during an election year. Depending on when you start your data, there have been either 22 or 23 different presidential elections since either 1932 or 1928. If you flipped a coin 22 times the odds of getting exactly 11 heads is just 16.8%. In other words, the odds that a data set of 23 presidential cycles represents the average or typical return is small. Most of the time you will get some random result that will make it look above or below what is truly average or typical.
With such a small statistical sample, it would be a mistake to infer that future results will reflect in any way such a small historical sample. Future results are much more likely to mimic the typical average.
The average return of the S&P 500 Price Index between 1928 and 2019 was 7.68%. During that time period, the years that were evenly divisible by 7 had a negative average return of -0.41% while the years that were evenly divisible by 17 had an average return of 21.62%. The year 2023 is evenly divisible by both 7 and 17. Do those “trends” suggest you should avoid investing in 2023? Or do they suggest that you should invest heavily? Neither, of course!
Trends appear in all data sets that have nothing to do with persistent trends. Only persistent trends can be used as predictive of future events.
My purpose in writing this article is to show how most articles which have been written about investing and the U.S. presidential election cycle should be ignored. It is always a good time to have a balanced portfolio. Investors should remain invested all the time, even during an election year.
Dana Anspach writes in “Stock Market Performance in Presidential Election Years “:
If you examine the return of the S&P 500 Index for each of the 23 election years since 1928, you’ll see that in only four of them was it negative.
Anspach reports that only 4 out of 23 election years (17.4%) have had negative returns. Stated in reverse, 19 of the 23 election years (83%) have had positive returns. Election years have been better than average. Under average returns, 26.5% of years show negative returns. Under this average, we would have expected about 6 of the 23 election years to have negative returns with only 73.5% or about 17 of the 23 years as positive.
Morgan Stanley advertises a document that suggests stock market returns are better in years in which Republicans are elected.

These statistics are skewed by the 2008 election in which the S&P 500 Total Return Index was down -37.0%. Crediting this downturn against Obama being elected hardly seems appropriate when George W. Bush was in office and Obama did not take office until January of 2009.
In contrast, the Capital Group in their Outlook for 2020 has a graph in which they chart typical investment returns in the S&P 500 Index by month for presidential election years and for years with no presidential election. They suggested that “election results, historically speaking, have made essentially no difference when it comes to long-term investment returns.”
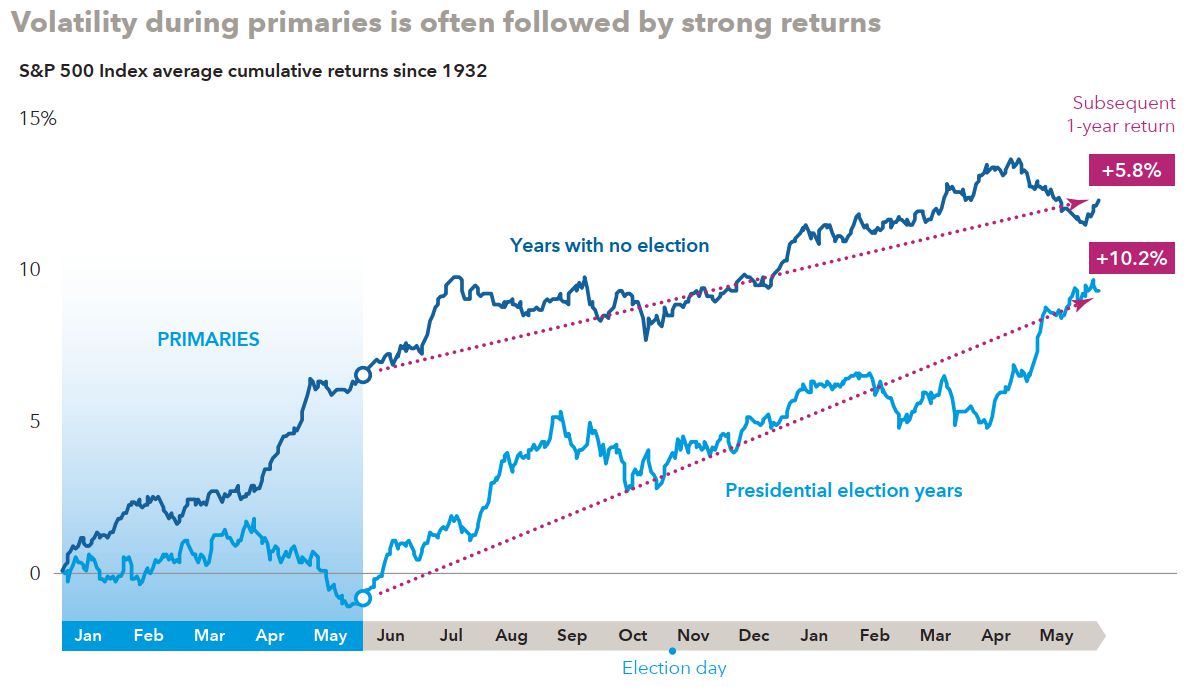
This graph suggests that election years drift sideways during the primary season while presidential contestants are being selected and then catch up for the subsequent year. If you took these statistics to heart, the Richmond investment company’s suggestion to get out of the markets in October would be terrible timing. If anything, this graph would suggest that investment returns after May in an election year will be above average.
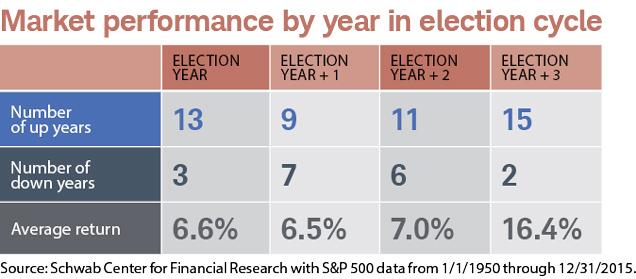
Charles Schwab’s Market Commentary from 2016 goes even deeper into the details suggesting that the election year + 3 (i.e. the year before an election year) does the best. Again with such a small sample we believe this level of analysis isn’t warranted as any future indicator.
Diving even deeper into the details, Schwab’s commentary divides the returns of each year of the presidential cycle by the returns of each sector of the U.S. economy.
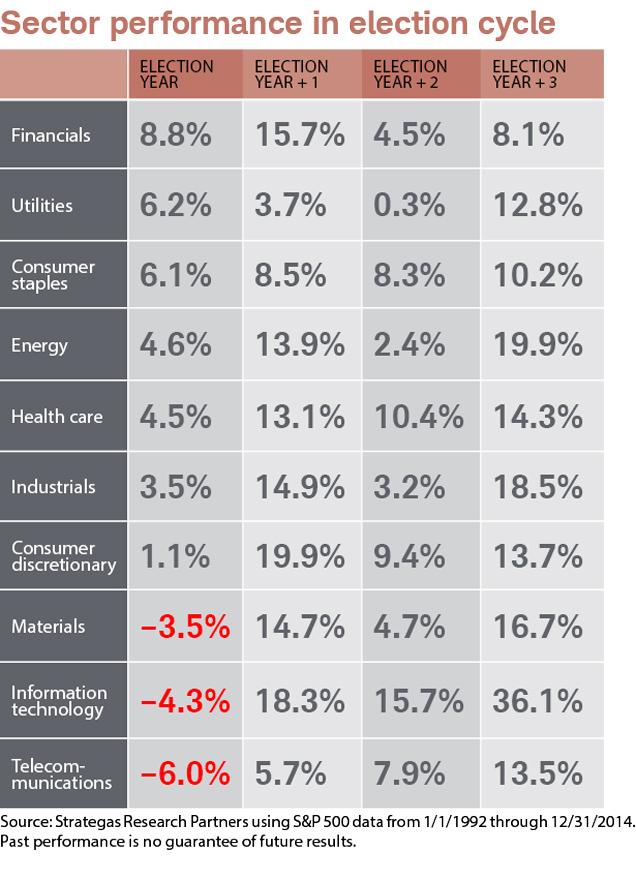
Given this data you would be tempted to invest in Financials during an election year, switch to Consumer Discretionary the next year, and then switch to Information Technology for the last two years. But before you do, bear in mind that this sector data is only from the very short time period of January 1, 1992 through December 31, 2014.
No investment decisions should be made based on only 23 years of data. Such a short time period is not long enough to be statistically significant.
In my earlier article “The Narrative Fallacy,” I tried to explain in just 400 words how and why our brains mislead us. In that article I wrote:
Movements in the stock market, up or down, don’t have a single cause. Market prices are the result of billions of shares of stock being bought or sold. Such volume has millions of causes. And very few of those causes coincide with any given narrative that you might hear through news sources or financial professionals.
Stories get simplified and compacted. When the story of a prediction is retold, past events are presented in light of what actually happened, ignoring details which would have supported a different outcome. The outcome is presented in terms of what actually happened rather than the vague emotional excitement or anxiety which actually comprised the prediction.
Our brains assume that their causal narrative is likely to be true. If we wrongly believe that they predicted future events correctly, we might be tempted to act on their assumptions going forward.
Narratives get attention. They fund science studies and attract charitable donations. They fuel political campaigns. They attract attention to financial news. No one would click on the headline, “Stocks went up today and we have no clue why.” And yet headlines like that would be more accurate than most of the popular financial news.
Similarly, we would advise, “It is always a good time to have a balanced portfolio.” And when you aren’t sure what to do, we would recommend, “Rebalance your portfolio toward your target asset allocation.”
Such uninteresting advice will not make the news headlines, but we believe it will result in better long-term portfolio growth.
Photo by Matthew Gonzalez on Unsplash
Latest posts from David John Marotta
- How To Distribute from A College America 529 Plan to an Account Owner - October 22, 2024
- #TBT Are Democrats Or Republicans Better For The Stock Market? - October 17, 2024
- How To Distribute from A College America 529 Plan to a Designated Beneficiary - October 15, 2024