The video “Wealth Inequality in America” was recently featured on Upworthy, a social media megaphone. It was then re-posted by a significant minority that’s become more infatuated with socialism. The video is not only misleading, but the research methods of its underlying study are laughable.
The content is based on a 2005 survey by Michael Norton and Dan Ariely, “Building a Better America–One Wealth Quintile at a Time,” that surveyed a group of Americans with the goal of determining the “ideal level of wealth inequality.”
Norton and Ariely claim that not only do Americans underestimate the distribution of wealth in the United States, but they prefer to live in a country with greater wealth equality. It’s important to examine how they arrived at this conclusion.
The survey offered participants three unlabeled pie charts showing possible distributions of wealth: 20% to each 20% of the population, Sweden’s distribution (36%, 21%, 18%, 15%, 11%) and the U.S. distribution (84%, 11%, 4%, 0.2%, 0.1%).
Participants were shown each pie chart paired with another and asked to select between them the country where they preferred to live. However, Norton and Ariely’s instructions limited their choice by the “Rawls constraint.”
Proposed by John Rawls in his 1971 book “A Theory of Justice,” the constraint is based on his theory that every member of society has an equal claim on a society’s goods and inequality can only be allowed if it offers advantages to those who are the worst off.
Rawls did not believe in the right to own the means of production or the freedom of contracts. His collectivist political theories have always been controversial and widely criticized.
When selecting the country the respondents wanted to join, the Rawls constraint was to “imagine that if you joined this nation, you would be randomly assigned to a place in the distribution, so you could end up anywhere . . . from the very richest to the very poorest.”
That absurd constraint actually defeats the goal of finding an “ideal level of wealthy inequality” because it predefines what “ideal” means. Everyone, given that instruction, should pick the most equal distribution. If wealth assignment was completely random, there would be no reason for anyone to gamble by choosing an unequal distribution.
Under these instructions, remarkably less than half (43%) chose the equal distribution. A total of 47% chose Sweden, a gamble. And 10% even chose the United States, the riskiest wager.
When the U.S. distribution, the most erroneous choice under the Rawls constraint, was paired with socialism, a surprising 23% of participants chose the United States.
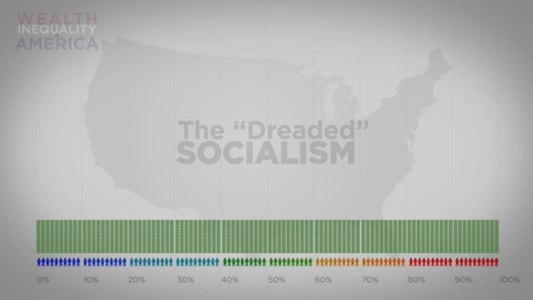
The filmmakers sarcastically call the equal distribution “the ‘dreaded’ socialism.” They state, “We all know that won’t work.” But despite the tone, most Americans in the study were so confident socialism wouldn’t work, they didn’t choose it. Even though it was the correct answer, they chose Sweden.
In truth, the participants probably just chose the middle of an odd number of options. Psychologists have observed that the most moderate choice tends to be the most popular when the question does not resonate with the participants. Furthermore, the anchoring effect likely encouraged them not to stray far from 20%.
Wealth inequality may not even be the measure we should be looking at. It could be caused either by economic freedom or a dictatorship.
There will always be individuals who have a net worth of zero. As of 2000, 15% of Americans were in this group. Any widespread economic growth will make the wealth gap increase. Only by limiting growth or redistributing wealth can inequality measures be held down during such growth periods.
However, wealth inequality can be the result of corruption. An administration that doles out wealth to those it favors while impoverishing or regulating others also creates wealth inequality.
The difference between these two regimes is that the one with economic freedom will have a higher gross domestic product (GDP) per capita, or average individual income.
In 2013, the Heritage Foundation’s Index of Economic Freedom, a study in its 19th year, again found a correlation between GDP per capita and economic freedom. The index reported that the difference between the GDP per capita of free and mostly unfree countries was $39,013.

Given that the average global GDP per capita is $12,500 (slightly lower than even the average of “moderately free” countries), it seems economic freedom ought to provide a better and more realistic criteria than wealth distribution under the Rawls constraint for choosing which country we prefer to live in.
Each year the Heritage Foundation has calculated the index, they have found a “strong relationship between economic freedom and levels of per capita income.” In addition to higher incomes, economic freedom has correlated to lower poverty rates, better education and more comprehensive health care.
The United States ranks 10th and “mostly free” on the index. Our GDP per capita is $48,387, the eighth highest.
The filmmakers of “Wealth Inequality in America” would like you to believe wealth inequality is horribly wrong. However, if the wealth gap comes from economic freedom and economic growth, wealth inequality may be more descriptive of prosperity and freedom than poverty and corruption. The film’s underlying study by Norton and Ariely describes the experimenters’ own bias more than the beliefs of the average American.
The underlying concern of everyone should be how to help those with very little income build net worth. In Part 2, we’ll explore why 15% of Americans have zero net worth and what we can do about it.
In the meantime, take comfort that economic freedom provides a better measurement of a healthy society and the United States still ranks relatively high.
Part 2 → |
Latest posts from David John Marotta
- #TBT A Review of Finances at Age 60 - July 25, 2024
- #TBT Implement the Automatic Millionaire at Schwab - July 18, 2024
- #TBT Stress Is Not Your Enemy - June 27, 2024
Latest posts from Megan Russell
- Four DPOA Limitations at Schwab and Their Solutions - July 23, 2024
- #TBT Implement the Automatic Millionaire at Schwab - July 18, 2024
- How to Implement a DPOA at Schwab - July 16, 2024