Recently we received an inquiry as to why we did not use more Fidelity funds for the 401(k) plans that we manage. Specifically we were asked why we did not include the Fidelity Select Biotech Portfolio (FBIOX) which has done well recently.
We’ve written about how to select securities but in this article we are going to apply those principles to the process of selecting a specific fund for a specific sector of the economy. The decision is which fund we should select to represent healthcare.
We use the Vanguard Healthcare Fund (VGHAX) which is comprised of 82 different stocks. FBIOX is made up of 262 holdings. This measure would favor the Fidelity fund. Having more holdings is a sign of diversification for the fund. There is no such thing as over diversified, more holdings is better.
For both of these funds, the top ten holdings of each fund represent 41% of the fund’s assets. This is not as diversified as it could be, but they are comparable in this way.
Foreign stocks represent about 10% of FBIOX and about 20% of VGHAX. Neither of these percentages matter to our definition of the Healthcare sector, but if we were specifically targeting or avoiding foreign stocks with the sector, it would be relevant.
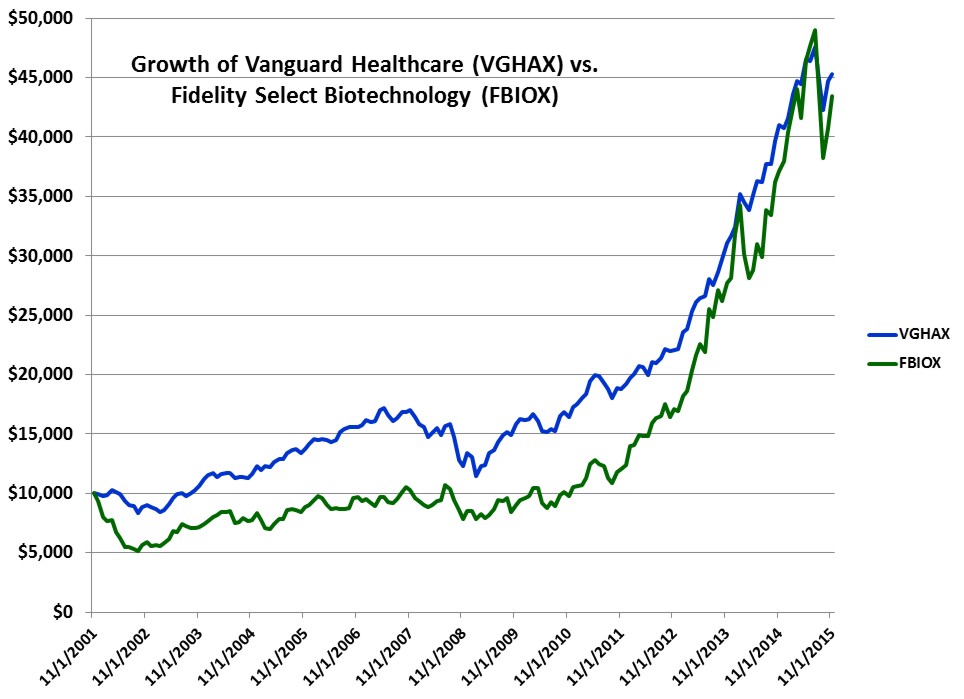
Both funds have a 14-year track record. Fourteen years may seem long but is still an insufficient time period for long-term investing statistics. Even the S&P 500 is flat or down for a decade about 6% of the time. The fact that both healthcare funds more than doubled the return of the S&P 500 over this time period is not an indication that they will perform this way going forward.
With those caveats in mind, here is how each fund performed. VGHAX had a better return over the fund’s histories. The return was both smoother and superior. A $10,000 investment in VGHAX grew to $45,335 vs. $43,435 for the Fidelity fund.
We specifically do not use how many Morningstar stars a fund has received. Morningstar themselves have done the analysis to show that selecting funds with low expense ratios is a better method of predicting superior future performance.
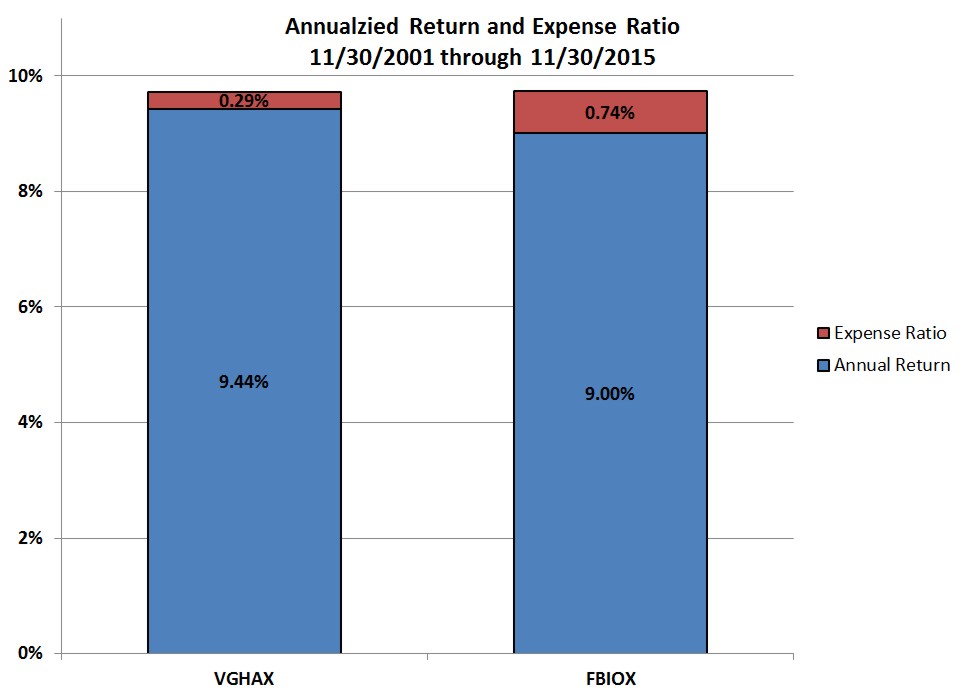
The Vanguard fund has an expense ratio of 0.29% while the Fidelity fund has an expense ratio of 0.74%. This 0.45% difference in expense ratio is a hurdle that the Fidelity fund has to work to overcome. Yet when you compare the average annualized return of the two funds, it appears that the Fidelity fund has simply underperformed the Vanguard fund by the difference in expense ratios.
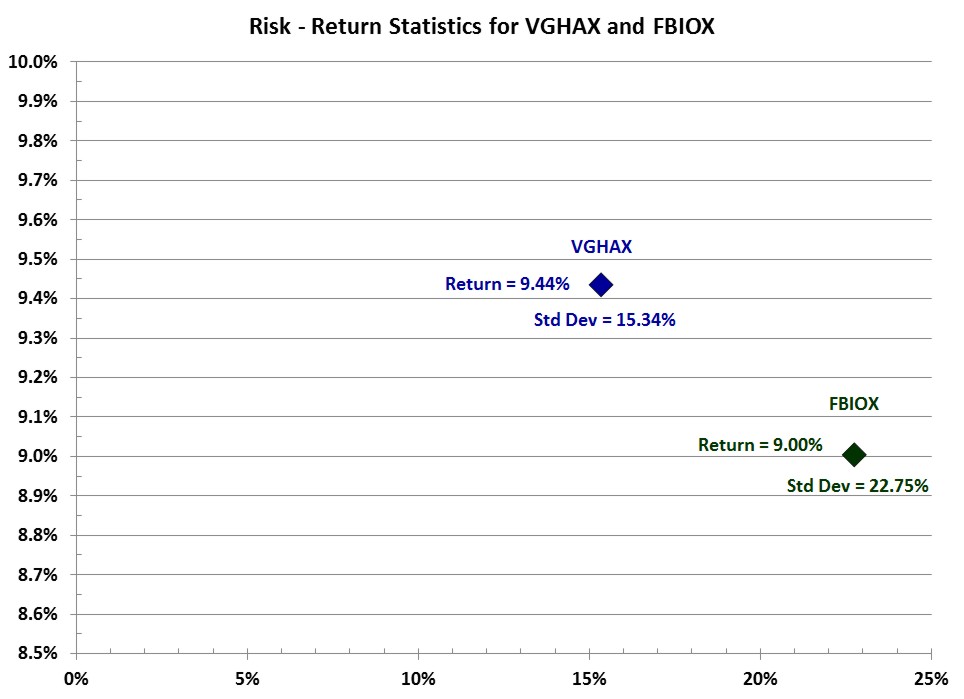
A final measurement is to see if the Vanguard fund had a superior return by taking additional risks. Risk is usually measured by measuring the standard deviation of annual returns. For the Vanguard fund the standard deviation of its annual returns was 15.34% while the Fidelity fund’s standard deviation was 22.75%.
The Fidelity fund’s greater volatility is probably a result of having a larger percentage of its investments in mid and small cap funds. The Fidelity fund has 47% of its holdings in large cap funds while the Vanguard fund has 89% in large cap. Mid and small cap companies exhibit greater volatility even when you are diversified among hundreds of smaller holdings.
Even though these two funds have very similar long term returns, in the short term they can be very different. Every month the delta between the return of each fund can be 10% or more in either direction. Here is a graph showing how much VGHAX out performed or underperformed FBIOX each month.

We do look at a fund ranking system put out by the Center for Fiduciary Studies at fi360.com. Fi360 ranks funds from 0 (best) to 100 (worst) within each sector. VGHAX has a 3-year average ranking of 10, and FBIOX has 26. One of the fi360 criteria is that the fund’s Sharpe ratio must score in the top 50% of its peer group.
Sharpe ratio is a measure of the historical return per amount of risk taken. The Fidelity fund scores poorly for having taken additional risk but not achieve a sufficient return to justify the risk taken.
Other criterion used by fi360 include having 80% of its assets actually being invested in the target sector or style, a 3-year track history, 75-million under management, and most importantly a relatively low expense ratio.
These criteria provide a simple short example of how we go about fund selection and why we selected VGHAS over FBIOX for the 401(k) plans we manage.
Latest posts from David John Marotta
- #TBT A Review of Finances at Age 60 - July 25, 2024
- #TBT Implement the Automatic Millionaire at Schwab - July 18, 2024
- #TBT Stress Is Not Your Enemy - June 27, 2024
Latest posts from Megan Russell
- Four DPOA Limitations at Schwab and Their Solutions - July 23, 2024
- #TBT Implement the Automatic Millionaire at Schwab - July 18, 2024
- How to Implement a DPOA at Schwab - July 16, 2024