 On Friday, February 9, 2024, the S&P 500 Price Index closed above 5,000 for the first time in history. It marked the 10th record close of 2024 and its third 100 point milestone for the year.
Articles regaling and celebrating this moment are plentiful. It has been called a “landmark moment ” and “a weighty breakthrough .” Other articles are self-aware enough to discuss the arbitrariness of the “headlines and hooplah ” and how such milestones are “‘psychological’ hurdles ” without real significance. Other authors still try to draw a conclusion from this new pricing and suggest that investors either sell the bounce or join the rally. However, as our readers have grown accustomed to hearing, the best advice in all markets is to rebalance.
The markets are inherently volatile and also inherently profitable.
We can measure when the S&P 500 Price Index sets a new high, but there aren’t any new lows. The markets have continued to trend upward for hundreds of years.
Sometimes, people wonder, “The markets can’t go up forever, can they?” However, the answer to that question is, “They have so far.” There have been corrections, bear markets, and even a crash or two along the way, but history tells us the markets trend upward like an escalator.
When the S&P 500 Price Index sets a new high, it may fall below that high, cross it again on the way back up, and cross it again on the way back down. What is assured, or at least has always happened, is that at some point the index will cross it on the way back up never to go below that value again.
This is also what I said in my December 27, 2019 article, “What To Expect Now That The S&P 500 Reached 3,200.” The S&P 500 Price Index closed above 3,200 for the first time in history on Thursday, December 19, 2019. Including that first milestone, the S&P 500 crossed 3,200 a total of five times over the next 209 days. Those were:
| Date | Close | Direction |
|---|---|---|
| 12/19/2019 | 3,205.370117 | up |
| 2/25/2020 | 3,128.209961 | down |
| 6/8/2020 | 3,232.389893 | up |
| 6/10/2020 | 3,190.139893 | down |
| 7/15/2020 | 3,226.560059 | up |
Since my previous article, we have had two Bear Markets to quickly revisit valuations, the 2020 COVID Bear Market and the 2022 Bear Market. Now, the average number of times the S&P 500 crosses a new hundreds value is 22, taking an average of 3.9 years in the process. These averages are a sign of the short-term volatility of the stock market. Because the market is volatile over short time periods, we recommend having at least 5 to 7 years of safe spending in bonds.
If this new 5,000 point high for the S&P 500 Price Index were an average crossing, we would expect to see the S&P 500 trading up 9.78% at 5,489 a year from now on February 9, 2025. We would also expect to see the S&P 500 subsequently drop below and rise above 5,000 another 22 times, not staying above that number until December 21, 2027.
If that level of volatility isn’t your expectation, you are not yet familiar with normal volatility in the markets.
Below is a complete guide to the S&P 500 Price Indexes 100 point milestones so far:
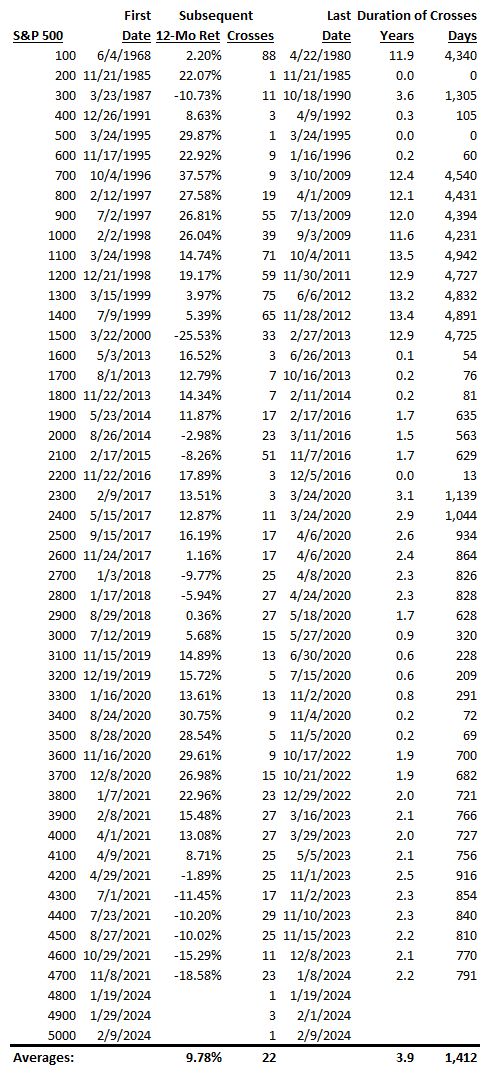
Photo by Warren Douglas Coetzer on Unsplash. Photo has been cropped.
Latest posts from David John Marotta
- How To Distribute from A College America 529 Plan to an Account Owner - October 22, 2024
- #TBT Are Democrats Or Republicans Better For The Stock Market? - October 17, 2024
- How To Distribute from A College America 529 Plan to a Designated Beneficiary - October 15, 2024