 2017 was such a good year for the stock markets that it set a record with 12 consecutive positive monthly returns. This was the most highs since 1910 for the Dow. And daily volatility was just 0.30%, much lower than the average of 0.65%.
It has the average investor worried. For over a year, many have been saying that a drop in the US stock market is inevitable. Nervous investors got out of the market months before the 2016 presidential elections and have missed a 26% rise since then.
Recently, I have heard people comment, “The markets can’t go up indefinitely, can they?”
Well, the US Stock Market is down a little bit at the beginning of February, 2018, but my first thought is that thus far the markets have indefinitely gone up, albeit interrupted by significant corrections.
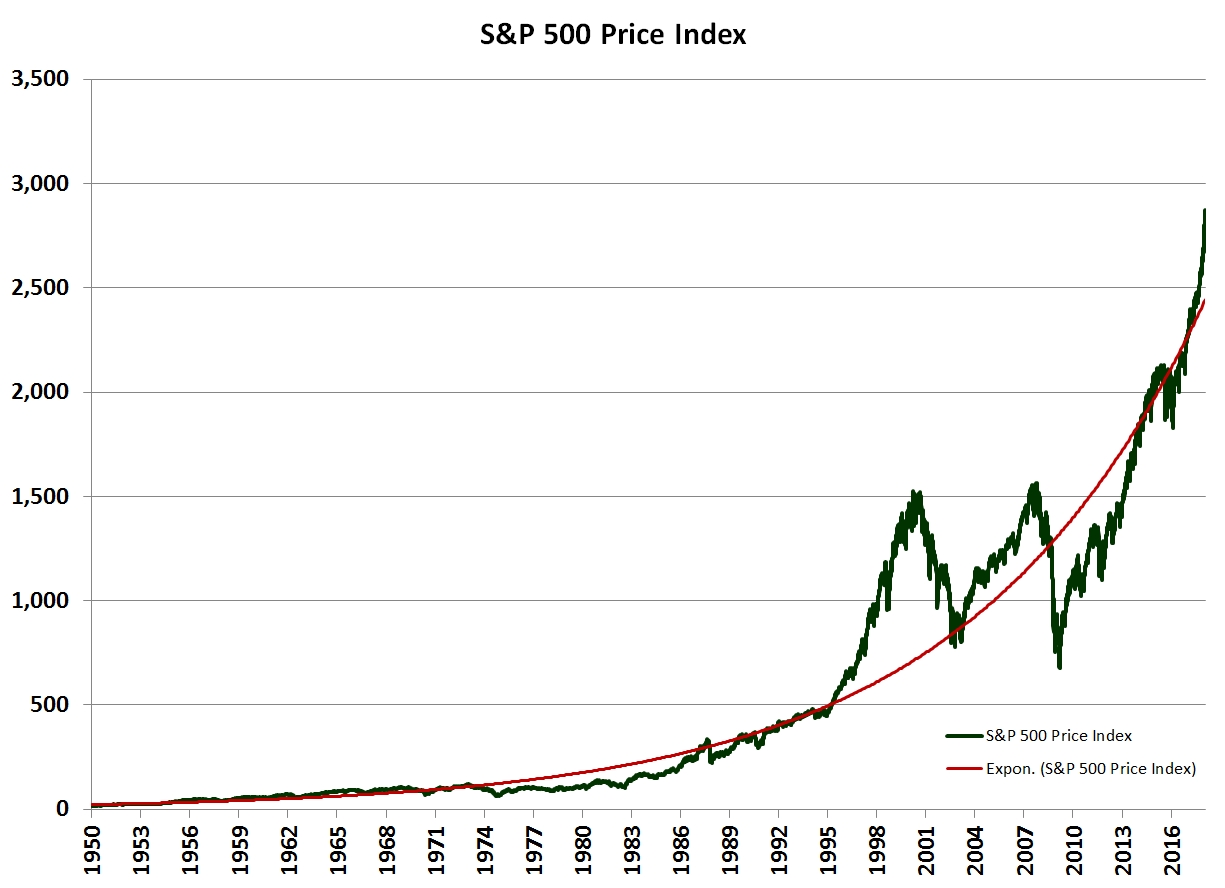 I have included a graph of the S&P 500 Price Index along with the best fitting exponential curve showing the upward trend of the US markets despite the significant corrections.
I used the S&P 500 Price Index rather than the S&P 500 Total Return Index. The Price Index only includes capital movements and is a better proxy for how people experience the ups and downs of the markets. My data is through February 2, 2018 and does not include the latest data in February.
I have also gradually been writing a series on each Bear Market to show how quickly they correct and how high the subsequent Bull Market rises. Bear Markets are not uncommon and also nothing to be feared.
Still the question is interesting: how long have the markets gone up without experiencing a correction?
A Bear Market is defined as an index dropping at least 20% from some previous high. Smaller drops in the market between 10% and 20% are called “corrections.”
 Corrections are very common.
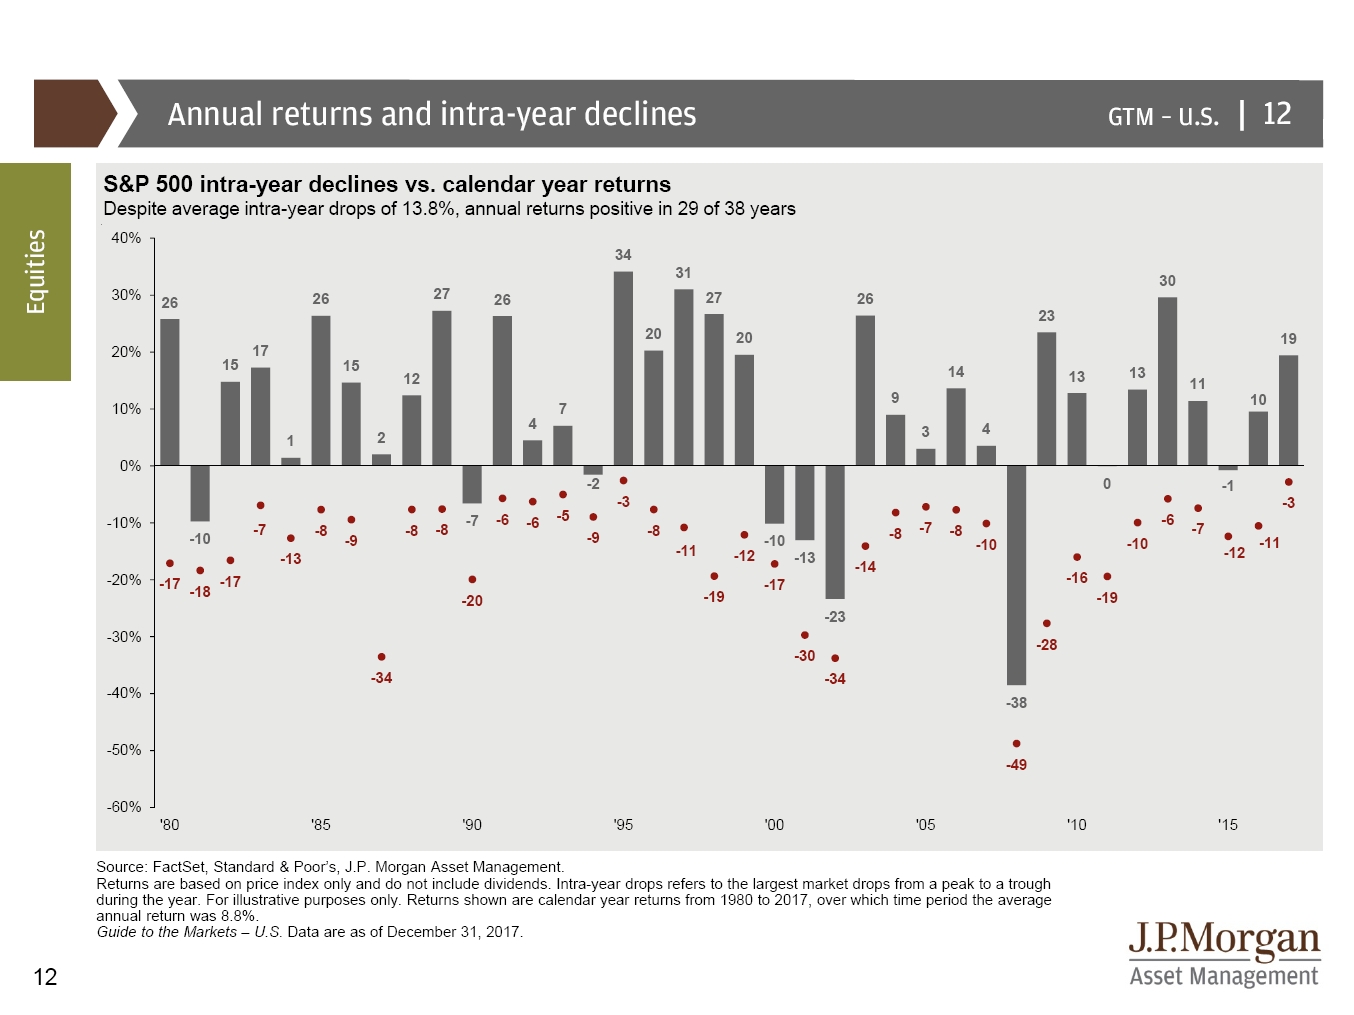
JP Morgan puts out a nice Guide to the Markets each quarter. My favorite page of the guide (reprinted here) shows the annual returns (the bars) and intra-year declines (the red dots) for each year.
This chart explains, “Despite average intra-year drops of 13.8%, the annual returns are positive in 29 of the last 38 years.”
On average at some point in the middle of the year there is a drop of 13.8%. A drop like this is normal. We should expect one every year, even in good years.
In 1998, the markets had a good year and were up 27% even though they had an drop of 19% in the middle of the year.
In 1987, the markets ended the year up 2% despite experiencing an intra-year drop of 34%.
Last year in 2017, the markets were very well behaved and experienced an intra-year drop of a mere 3% ending the year up 19%.
The longest the markets have gone without being down more than 11% has been 7.6 years between January 18, 1991 and August 26, 1998. That is long time for the markets to go up without experiencing the normal 13.8% intra-year correction. You can see this period of well-behaved markets on the JP Morgan Guide to the Markets between 1991 and 1997. The -11% they list in 1997 was actually -10.8%, barely within the -11%.
The current market is on a 1.96 year streak since the last -11% return. Just 1.98 years ago, the markets were down as much as -14%.
With such a recent decline there is nothing remarkable about the current run of almost two years of well behaved markets.
The longest the markets have gone without being down more than 20%, the definition of a Bear Market, has been 12.28 years between November 29, 1998 and March 9, 2001.
The last Bear Market was 6.10 years ago on December 28, 2011. The markets were still recovering from the 2008 Market Crash. On that date, the market was still down over 20% from the high 4.22 years earlier on October 9, 2007. Of course by then the market had been recovering for 2.8 years and would continue to appreciate until now. These larger drops of at least 50% are called a “crash.”
So far in the S&P 500 Price Index, we have only had the one crash in 2008 and the recovery was relatively swift.
There is nothing remarkable about the latest run for the markets.
The longest the markets have gone without being down more than 28% was 20.35 years and without being down more than 34% was 26.60 years.
While corrections and even Bear Markets may seem inevitable, so does the gradual appreciation of the markets.
Photo by Tim Marshall on Unsplash
Latest posts from David John Marotta
- How To Distribute from A College America 529 Plan to an Account Owner - October 22, 2024
- #TBT Are Democrats Or Republicans Better For The Stock Market? - October 17, 2024
- How To Distribute from A College America 529 Plan to a Designated Beneficiary - October 15, 2024