In “What Is Turnover Rate?“, we explained how turnover is the measure of what percentage of the stocks making up a fund are sold and exchanged for new ones each year. We explored how turnover is therefore a measure of the fund manager’s belief that short term trading will produce superior returns. We then began exploring the relationship between turnover rate, number of holdings, and 3- and 5-year returns.
In “What Is The Relationship Between Turnover Rate And Number Of Holdings?”, we saw the general correlation of greater holdings and less turnover holds for funds with at least 100 holdings. But oddly enough, funds with fewer than 100 holdings had the lowest turnover ratio of all. This caused us to look at how funds with fewer than 100 holdings performed in terms of 3- and 5-year returns.
In “What Is The Relationship Between Number Of Holdings and Returns?“, we learned that funds with fewer than 100 holdings had the worst 3- and 5-year returns. Having over 500 holdings (generally) produced the best returns.
However, all of these blog posts dance around the real question: Does actively trading a portfolio produce superior returns?
So to answer that with an example, do mutual funds with a lower turnover rate have higher average returns?
I again exported the turnover rate and 3- and 5-year returns for all the mutual funds in the U.S. Small Cap Value Morningstar category from Morningstar. There were 407 funds with a 3-year return. I split the 407 funds into the following categories: 0-14% turnover rate (16), 15-24% turnover rate (43), 25-49% turnover rate (155), 50-74% turnover rate (88), 75-109% turnover rate (59), 110-7,000% turnover rate (46).
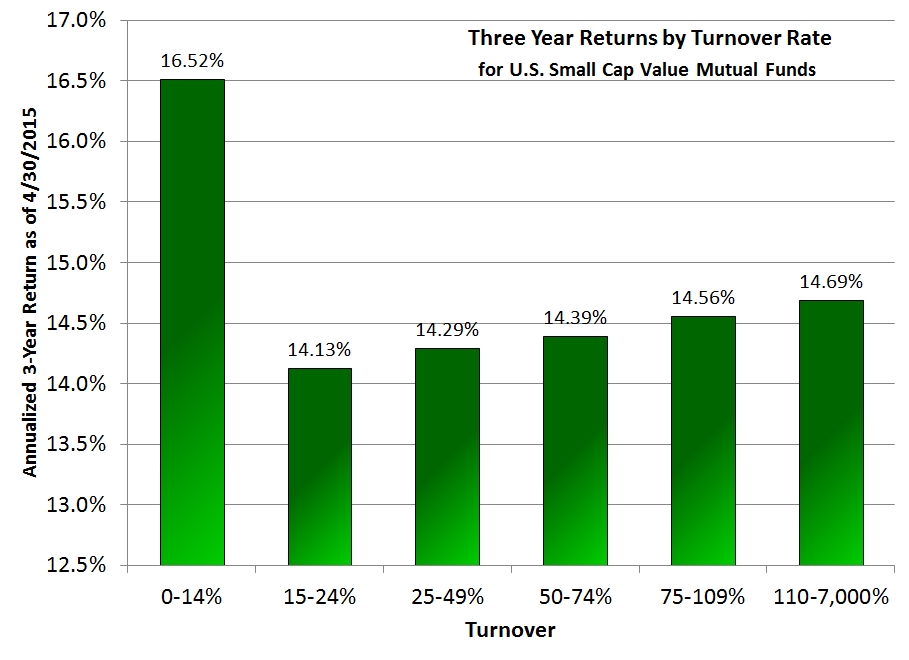
Here is the relationship between turnover rate and 3-year annualized returns as of 4/30/2015:

As this chart shows, having a turnover rate under 15% might be worth as much as 2.21%. Once you start actively trading, you might be able to boost returns back up 0.56% if you trade over 100% a year, but the best returns for high-turnover funds were still far lower than for funds with low turnover.
By way of comparison, Vanguard Small-Cap Value ETF (VBR) (which we recommend in our gone-fishing portfolio) had an annualized 3-year of 18.14% over the time period studied in the chart above.
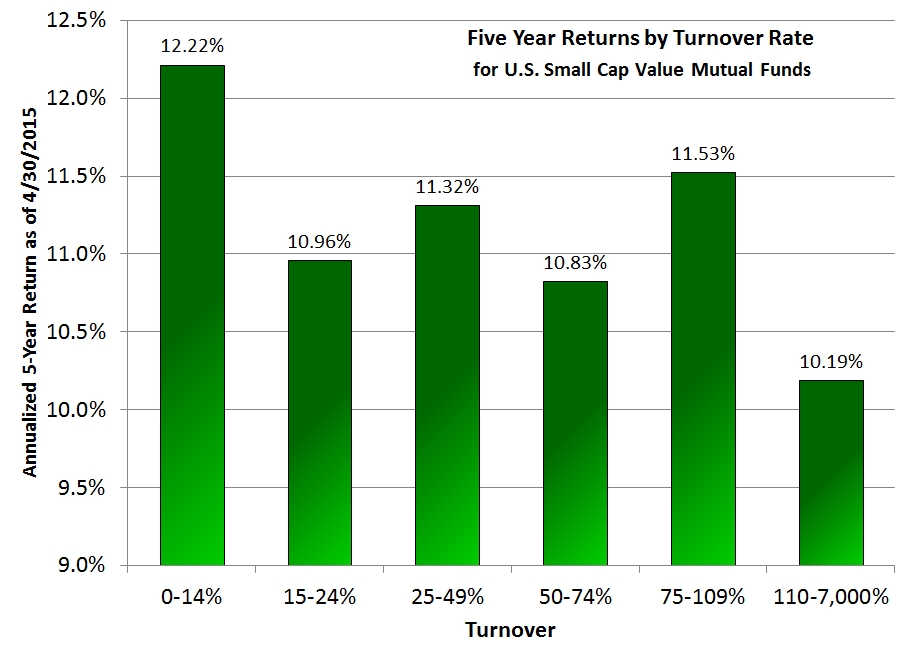
Here are the 5-year annualized returns by turnover rate:

The 5-year data shows that low turnover is correlated to a higher average return by between 0.69% and 2.03%. In the 5-year data, the highest turnover rate had the lowest return while in the 3-year data it had the highest return among actively-traded funds.
Perhaps the lesson is that with a turnover rate greater than 100%, your returns will vary more from the average. But then again, you are just as likely to be at the top as at the bottom. Infrequently-traded funds on average managed to outperform all others while the funds that got the most attention and trading from their managers switched from the highest returns for active trading in the short-term to the lowest returns in the long-term.
Meanwhile, Vanguard Small-Cap Value ETF (VBR) had an annualized 5-year return of 13.42% over this period.
Clearly, a high turnover rate is not something you want in a stock fund. When fund managers actively trade a stock fund it produces lower returns than if they trade less than 15% each year.
Photo used here under Flickr Creative Commons.