
Distinguishing between what constitutes an asset class and what constitutes a sub-category is part science and part art. We use six asset classes, one of which is US stocks. Other advisors split US stocks into large cap, mid-cap and small-cap and make each of these a separate asset class. We do not. We put them all in the US stock asset class and use them as sub-categories of US stocks.
So what difference does it make? So long as you rebalance both asset classes and subcategories isn’t the rebalancing the same either way? Not always.
When an investment advisor uses US style boxes as asset categories they tend toward equal weight between asset classes and end up with an asset allocation that looks something like this:
- 20% US Large Cap
- 15% US Mid-Cap
- 10% US Small Cap
- 20% US Value
- 20% US Growth
- 15% Foreign Stocks
But when an advisor uses style boxes only as a sub-category they tend toward an asset allocation that looks something like this:
45% US Stocks
- 12% US Large Cap
- 10% US Mid-Cap Value
- 9% US Small Cap Value
- 7% Technology
- 7% Healthcare
55% Foreign Stocks
- 7% Hong Kong
- 7% Singapore
- 7% Australia
- 2% New Zealand
- 7% Switzerland
- 7% Canada
- 18% Emerging Markets
In the first allocation, broad indexes are selected at the top level asset allocation. Five out of the six asset classes all move in sync with one another. As a result, 85% of the portfolio has high correlation and therefore a very low rebalancing bonus. Foreign stocks are almost an afterthought, and therefore very little of the portfolio is allocated to them. This is a common allocation among commission-based advisors who pick mutual funds with unnecessary 12b-1 fees. Many of these fund families mostly have US stock funds and therefore build allocations that are US-centric. Since the best foreign funds are not commission-based, specific foreign investments are often missing from a commission-based advisor’s asset allocation and therefore missing from their asset-allocation models.
In the second allocation, the best performing investments have been chosen in the top level asset category. Underperforming sub-categories have not been selected. For example, small cap growth has not been selected because it is not on the efficient frontier. And specific foreign investments have been selected rather than just investing in the EAFE Index.
Generally we use correlation to decide if two categories should be different asset classes or just different sub-categories. The lower the correlation, the greater the justification for the different categories being different asset classes. Conversely, the lower the correlation, the greater the boost in returns when you rebalance. This is because correlation means those investments will perform similarly, meaning a portfolio investing heavily in both is not properly diversified.
So the question is, what is the correlation between the different styles of US stock: value growth, large, mid-, and small-cap stocks?
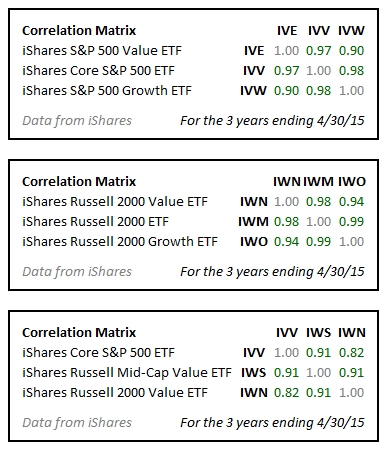
The first set of data shows that the correlations between large cap, value, and growth are all 0.90 or higher.
The second set of data shows that the correlations between small cap, value, and growth are all 0.94 or higher.
The third set of data shows that there is a lower (but still substantially high) correlation between US large cap and mid- and small cap value. The correlation over the past three years between the S&P 500 and the Russell 200 value has been as low as 0.82. If you can only pick two types of US stock investments, US large cap plus small cap value is a good diversification. We often use these two indexes in our Marotta Gone-Fishing Portfolio., but we use Vanguard S&P 500 ETF (VOO) and Vanguard Small Cap Value ETF (VBR). Having said that, 0.82 is not a low enough correlation in my mind to justify being separate asset classes.
Here is the historical correlation between iShares S&P 500 ETF (IVV) and iShares Russell 2000 Value ETF (IWN):
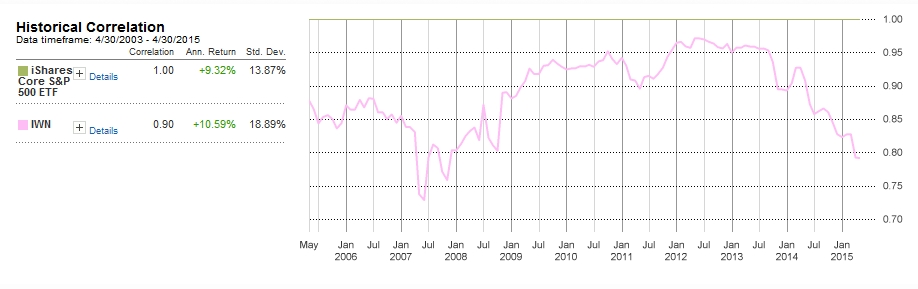
As you can see, the correlation between US Large Cap and US Small Cap Value rarely drops below 0.80.
And since correlations are generally higher than 0.80, different styles of US Stocks are generally best considered all part of the same asset class.
Photo used here under Flickr Creative Commons.
Latest posts from David John Marotta
- #TBT A Review of Finances at Age 60 - July 25, 2024
- #TBT Implement the Automatic Millionaire at Schwab - July 18, 2024
- #TBT Stress Is Not Your Enemy - June 27, 2024