
Correlation is an important measurement used when examining the volatility of investments and the diversification of an asset allocation. We use the term in many other articles and therefore thought it important to take the time to talk about what correlation means.
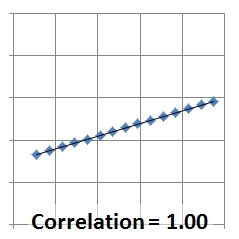
Correlation is a measure between 1.00 and -1.00 of how much two sets of data move in sync with one another. A correlation of 1.00 means that they always move in sync with one another. A negative correlation means that they usually move in opposite directions. Correlation can be charted by putting the two variables being examined on an X-Y chart and seeing how far away from the trend line individual data points are. Here is an example of perfect positive correlation:
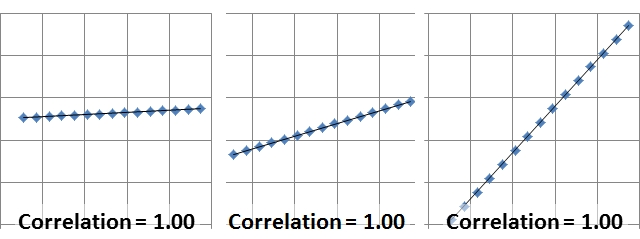
Two variables which always move in sync with one another have a correlation of 1.00 even when each variable increases by a different amount. On an X-Y chart this means that the slope of the line does not measure correlation, but rather how far from the trend line the average point is. All of these have a correlation of 1.00:
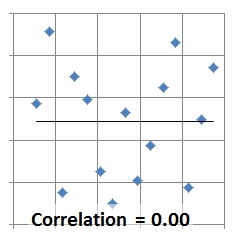
Here is an example of a chart of two variables which have no correlation. There is both no trend line and no proximity of points to the trend line:
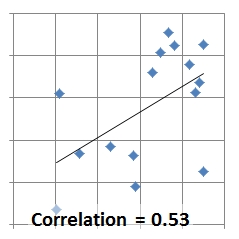
Oddly enough, if you throw random numbers for X and Y, the correlation won’t always be zero. Any finite number of data points might have a correlation anywhere between 1.00 and -1.00. The greater the number of data points, the more likely that two sets of random numbers will approach a correlation of 0.00. Here is an example of a small enough set of random numbers that it accidentally has a correlation of 0.53:
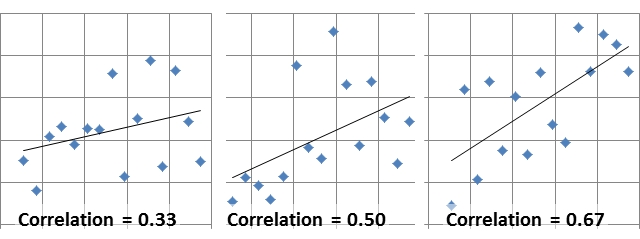
Most stock index returns have a relatively high positive correlation to each other, often between 0.85 and 1.00. Asset categories whose correlation drops below 0.85 can provide a significant benefit to portfolio construction. And even indexes which are above 0.85 can still provide some benefit to the extent they are less than 1.00. Here is a visual guide to what various correlations look like:
Correlations can also be negative, meaning when one asset is going up the other asset is often going down:
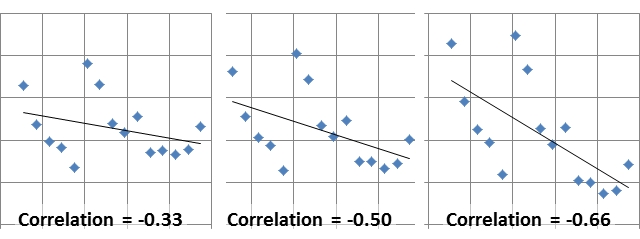
Notice that the three charts showing negative correlation show basically the same set of data. In the charts showing a larger negative correlation the data points have simply been stretched farther from the trend line. Indexes with a negative correlation are rare. But they are also extremely valuable for portfolio construction.
Why is correlation important to asset allocation?
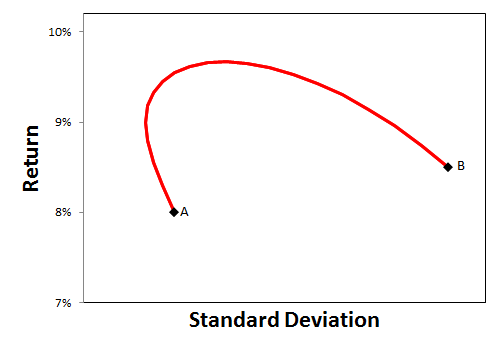
Inversely correlated investments can reduce the volatility (as measured in the standard deviation of portfolio returns) for an asset allocation between the two investments.
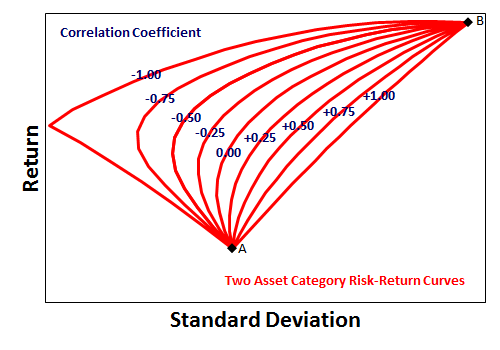
Low correlation can also boost returns for an asset allocation between two investments with a roughly equivalent expected return.
We use historical correlation measurements to help define what qualifies as an asset class and what is simply a sector or subsector. The lower the correlation the greater the benefit in asset allocation. The measurements over a specific time period is science, but the generalization to a specific allocation going forward is art.
Investors should want to build a portfolio of non-correlated assets. They should want to be diversified across asset categories which do not move in sync with one another. But many investors complain when one of their investments has gone down during the same time period when other investments have gone up. They believe that someone should have known which investments were going to go up and which investments were going to go down. What they miss is that having a properly diversified portfolio means something should always be going up and there should be little risk of everything going down.
We have a saying we use in the firm: “A good asset allocation means you always have something to complain about.”
Photo used here under Flickr Creative Commons.
Latest posts from David John Marotta
- #TBT A Review of Finances at Age 60 - July 25, 2024
- #TBT Implement the Automatic Millionaire at Schwab - July 18, 2024
- #TBT Stress Is Not Your Enemy - June 27, 2024