 As most clients and readers know, we have been revisiting our asset classes and running efficient frontier analysis to determine if we still have the long-term historical returns to justify our investment decisions. This analysis is what helped us to tilt more towards Healthcare and Technology while adding Consumer Staples and Biotechnology to U.S. Stock allocations, as well as help us to remove our Energy overweight from our Resource Stock allocations.
When reviewing our Foreign allocations, we discovered that the foreign Health Care sector has shown high risk-adjusted performance and foreign Financials has shown low risk-adjusted performance when compared to the other nine foreign sectors over most time periods. As a result of these findings, we decided to tilt toward foreign Health Care and away from foreign Financials in our Freedom Investing strategy. While I reported on this change to our strategy previously in “We Added a Sector Tilt to our Foreign Dynamic Tilt (November 2020),” it took me longer to write up this explanatory article.
In this article, I’d like to share some of the analysis we used to come to this decision.
A Comparison of Foreign Sectors
We used the All Country World Index excluding the United States (ACWI ex US) to represent foreign stocks. On Morningstar, the first month of returns for ACWI ex US Index is January 1995, and we were able to find returns broken down into each of the 10 sectors.
From January 1995 through December 2020, the Health Care sector of this foreign stock index saw an annual return of 9.81% with a standard deviation of only 13.21%. This is a coefficient of variation (COV) of 1.35, which represents how many units of risk you had to tolerate in order to achieve one unit of return over the time period.
This can be compared to the other sectors of the ACWI ex US over the same time period as follows:

You can see from this graph that over the time period both foreign Health Care and foreign Consumer Staples had a better risk-adjusted return than the remaining sectors.
When we shorten the data to only more recent times, both foreign Health Care and foreign Consumer Staples still stand out as having good risk-adjusted returns. Here are the same sectors from January 2010 through December 2020:
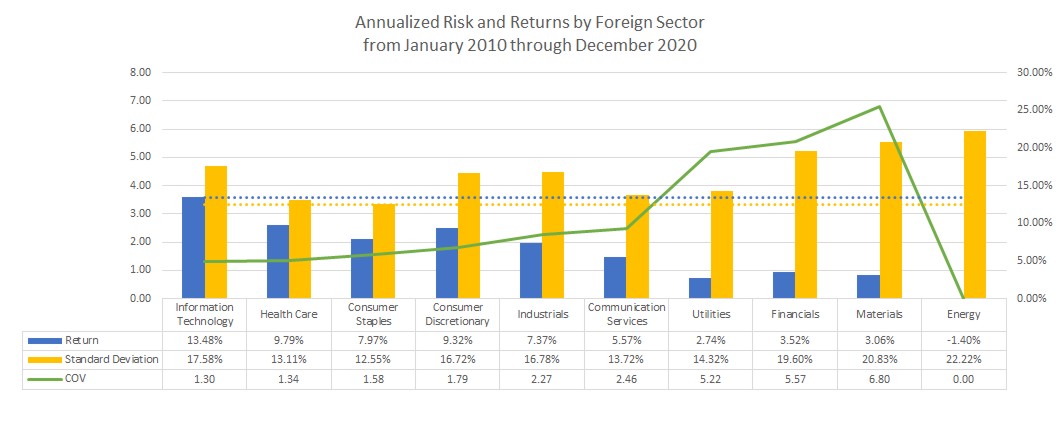
These same findings seem to hold true across time periods tested.
Efficient Frontier Analysis
The next step was to see how these two sectors integrate into the U.S. strategy we’ve already discovered. Frequent readers of our articles will remember that in the United States, we found a portfolio of Consumer Staples, Health Care, Technology, and Biotechnology held a solid place on historical efficient frontier graphs.
When these two sectors from the ACWI ex US are run on the efficient frontier from January 1995 through December 2020 with USA Investable Market Index (IMI) for Health Care, Consumer Staples, and Information Tech, the foreign Health Care sector has a place in efficient frontier portfolios between 10% and 30% of the overall portfolio while foreign Consumer Staples is only on the efficient frontier in the lowest risk and lowest return portfolios in a 10% allocation.
With the same indexes but tightening the time period to January 2010 through December 2020, foreign Health Care still has up to a 20% place in efficient portfolios while foreign Consumer Staples is again present only in the lowest risk and lowest return portfolios in a 10% allocation.
Over one of foreign stocks’ better time periods, January 1995 through December 2005, foreign Health Care has allocations up to 50% in efficient portfolios and foreign Consumer Staples is still only present in the lowest risk and lowest return portfolios, though its allocation in those portfolios can get up to 40%.
From this analysis, you can see how an overweight to foreign Health Care may help portfolios.
While this data could be used to justify an overweight to foreign Consumer Staples and such a weighting might be appropriate in portfolios engaging in risk avoidance, we found that over most time periods the addition of Consumer Staples in efficient portfolios decreased both risk and return sharply. As most of our clients are hoping for capital appreciation more than principal protection, we decided not to integrate foreign Consumer Staples into our portfolios at this time.
Foreign Health Care has a correlation to U.S. Consumer Staples, Health Care, and Technology respectively of 0.58, 0.68, and 0.35 from January 1995 and 0.66, 0.80, and 0.62 from January 2010 through December 2020.
When it comes to correlation, it is not surprising that foreign Health Care had the highest correlation to U.S. Health Care at 0.6761 from 1995-2020, 0.61 from 1995-2010, and 0.80 from 2010-2020.
Over the longest time period of 1995-2020, foreign Health Care had a correlation of 0.5813 to U.S. Consumer Staples and 0.3489 to U.S. Technology. This can be compared to U.S. Health Care which over the same time period correlated to Consumer Staples and Technology at the higher 0.6520 and 0.5155 respectively.
If two strategies or portfolios are correlated highly enough (higher than 0.84), then their types of risk overlap sufficiently to be part of the same asset class or to serve the same strategic purpose in a portfolio. With lower correlations, this makes foreign Health Care an effective diversification from the U.S. sectors. U.S. Technology and foreign Health Care, with the lowest correlation, provide especially effective diversification.
The lower correlation also suggests a higher rebalancing bonus. William J. Bernstein has suggested that you can calculate the rebalancing bonus between two investments by using the difference between its mean variance and covariance. Using this expected rebalancing bonus formula, this time period suggests that the 50-50 rebalancing bonus between U.S. Technology and foreign Health Care may be 0.76%.
From January 1995 through December 2020, an equal weight portfolio of foreign Health Care, U.S. Technology, U.S. Consumer Staples, and U.S. Health Care showed an annual return of 12.23%, standard deviation of 13.07%, and COV of 1.07.
This was 0.78% less return than its best component of Technology (12.23% compared to 13.01%), 12.90% less standard deviation than its riskiest component of Technology (13.07% compared to 25.97%), and a 0.10 superior COV than its most risk-adjusted components of U.S. Consumer Staples and U.S. Health Care (1.07 compared to 1.17).
This shows how a well diversified portfolio can be better than the sum of its parts over long time periods, even though in any given month diversification means that the overall portfolio will never place first.
For comparison, an equal weight portfolio including foreign Consumer Staples would have seen an annual return of 11.608%, standard deviation of 12.428%, for a COV of 1.07. You can see how this portfolio, while just as risk-adjusted, has experienced both less return and less standard deviation.
Narrative Explanation
Foreign Health Care has several facts which give it a strong narrative for good performance.
High Demand
The demand for acute care has an inelastic demand curve, meaning that individuals will purchase the good or service regardless of the price. This makes sense, as the choice between die wealthy today or live longer impoverished is an obvious one.
Most other healthcare services are elastic and the amount of demand is heavily driven by the price. Home visits, psychotherapy sessions, and physical therapist evaluations, for example, are all elective healthcare expenditures and therefore elastic. Even the demand for doctor visits about cold symptoms depends on the cost to the patient.
However, in countries with third-party-payer markets or socialized medicine, the price is artificially lowered for the patient and the remainder picked up by the third party. This increases the demand at the total compensation price beyond what normal market forces would create, opening up more room for profit.

Government Subsidies
One of the most costly parts of medicine is spending capital to pursue the promise of research. If your research doesn’t pan out, all your investment could be lost. Fortunately for the Health Care sector, medicine has a lot of political favor and medical research is a favorite recipient of government subsidies. In this way, governments help to mitigate one of Health Care’s greatest risks while leaving the profitable return for the company to reap.
Less Sensitivity to Currency Changes
In general, foreign stocks have more risk than domestic stocks thanks to the additional exchange rate risk. Buying securities denominated in foreign currencies means that the market price will fluctuate based on the relative value of the two underlying currencies. This is one reason why foreign stocks have a hard time finding their way into efficient frontier portfolios; during some time periods, foreign stocks add volatility, thanks to currency changes, without adding the same amount of additional return.
However, there are more ways that exchange rates affect international stocks. If the company owns or relies on a good which itself is heavily imported or exported, then the company’s own profits may fluctuate based on exchange rate changes.
For example, when the home currency strengthens, then the company’s exports would become more expensive for foreign consumers using a different currency while at the same time domestic consumers may be able to import competitor products for less than before. Meanwhile, when the home currency weakens, purchasing imported raw materials may become more expensive for the company and hurt profits.
In these ways, industries that rely on imports or exports are particularly sensitive to currency changes.
Health Care, however, seems to be less sensitive to currency changes than other sectors.
When looking at rolling 12-month returns (as measured by the subsectors of ACWI ex US) and comparing them to rolling 12-month U.S. inflation (as measured by the Consumer Price Index for All Urban Consumers), you can see how Health Care weathers the various kinds of inflationary periods gracefully.
Here is the performance of each foreign sub-sector over various types of inflationary periods, where “High” is over and “Low” is under 2.5% 12-month inflation and “Rising” means higher than and “Falling” means smaller than the prior 12-month period:
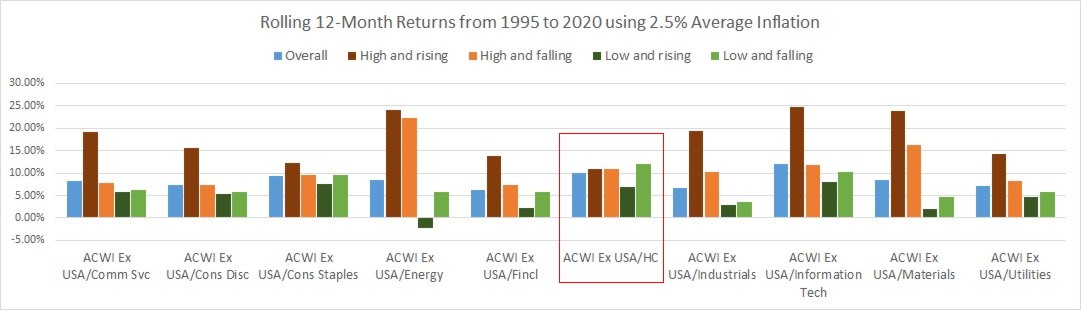
You can see foreign Health Care (which is boxed in red) has consistent returns over all inflation types with an average 12-month return of 10.09% over all time periods, 10.92% in high and rising, 10.89% in high and falling, 7.00% in low and rising, and 12.03% in low and falling.
Other sectors demonstrate more variation of returns across time periods with Consumer Staples being the second most consistent sector.
Using the same data, I ran the analysis again, but this time instead of comparing the current 12-months of inflation to the same time period’s returns, I compared the prior 12-months of inflation to the next 12-month’s returns. This is another way of looking at the sensitivity to inflation. Those results were:
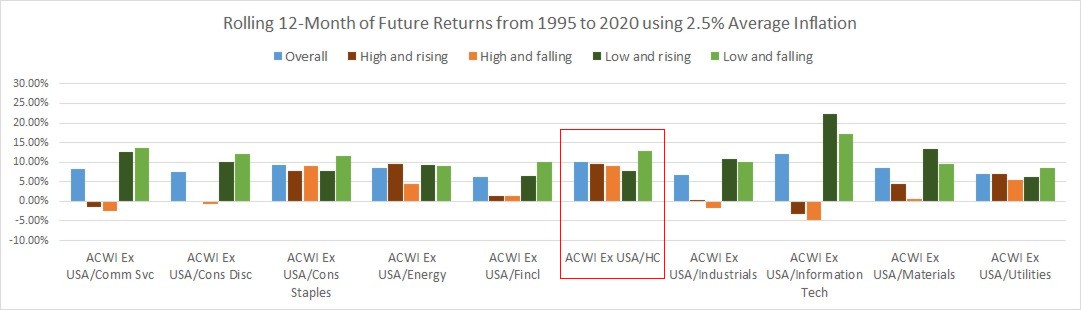
You can see again that Health Care (which is boxed in red) has consistent returns with the average annual future return ranging from 12.82% (low and falling) to 7.72% (low and rising). Again, other sectors demonstrate more variation of returns across time periods, with a few exceptions including Consumer Staples.
Reasons for the consistency may be that when patented medicine is exported to the global markets the patent ensures that there are not very many comparable competitors. Another might be that healthcare services, like your primary care provider or your hospital care team, are not easily imported or exported. Yet another reason may be the consistency of co-pays and/or price controls.
Regardless of the price reason, this finding is likely what makes Health Care less volatile compared to other foreign sectors.
Concluding Thoughts
On the efficient frontier, U.S. Consumer Staples, U.S. Healthcare, and U.S. Technology are the sectors that dominate the efficient allocations. Over most time periods, a blend of U.S. Technology and U.S. Healthcare represents the highest-return efficient portfolios while U.S. Consumer Staples, sometimes by itself, represents the lowest-risk efficient portfolios. In the middle, the portfolios with the best risk-adjusted return are often a blend of these three sectors.
When you add foreign sectors to the mix, foreign Health Care uniquely has a significant place in portfolios with the best risk-adjusted returns.
From January 1995 through December 2020, an equal weight portfolio of foreign Health Care, U.S. Technology, U.S. Consumer Staples, and U.S. Health Care showed an annual return of 12.23%, standard deviation of 13.07%, and COV of 1.07. Over the same time period, the U.S. sectors alone would have showed an annual return of 12.83%, standard deviation of 14.41%, and a COV of 1.12.
From this you can see that, while the addition of foreign Health Care did lower returns, it’s low correlation with the U.S. also lowered the portfolio’s overall volatility.
We hope that these findings hold true for future time periods. As always, our Investment Committee will continue to monitor our portfolio targets and make adjustments when we believe we have the data to justify the changes.
Photo by Ava Coploff on Unsplash
Latest posts from Megan Russell
- #TBT Don’t Increase Your Bond Allocation In Bear Markets - October 24, 2024
- How To Distribute from A College America 529 Plan to an Account Owner - October 22, 2024
- How To Distribute from A College America 529 Plan to a Designated Beneficiary - October 15, 2024