A Bear Market is defined as an index dropping at least 20% from some previous high. Smaller drops in the market between 10% and 20% are called “corrections.” Larger drops of at least 50% are called a “crash.”
Since 1950 there have been exactly nine Bear Markets in the S&P 500 Price Index (the most common representation of “the market”). Only one of these turned into a stock market crash. The other eight stopped dropping before the loss from peak to bottom was greater than 50%.
Although you might think that only eight Bear Markets over 65 years makes its occurrence uncommon, their duration averages about 3.3 years from peak to bottom and back to full recovery. In fact, the S&P 500 spends 18.19% of the time with losses of 20% or greater from some previous high. That means that, on average, 66 days of each year the S&P 500 Price index is down more than 20% from some previous high.
Examining past Bear Markets can help provide some context when we experience the next one.
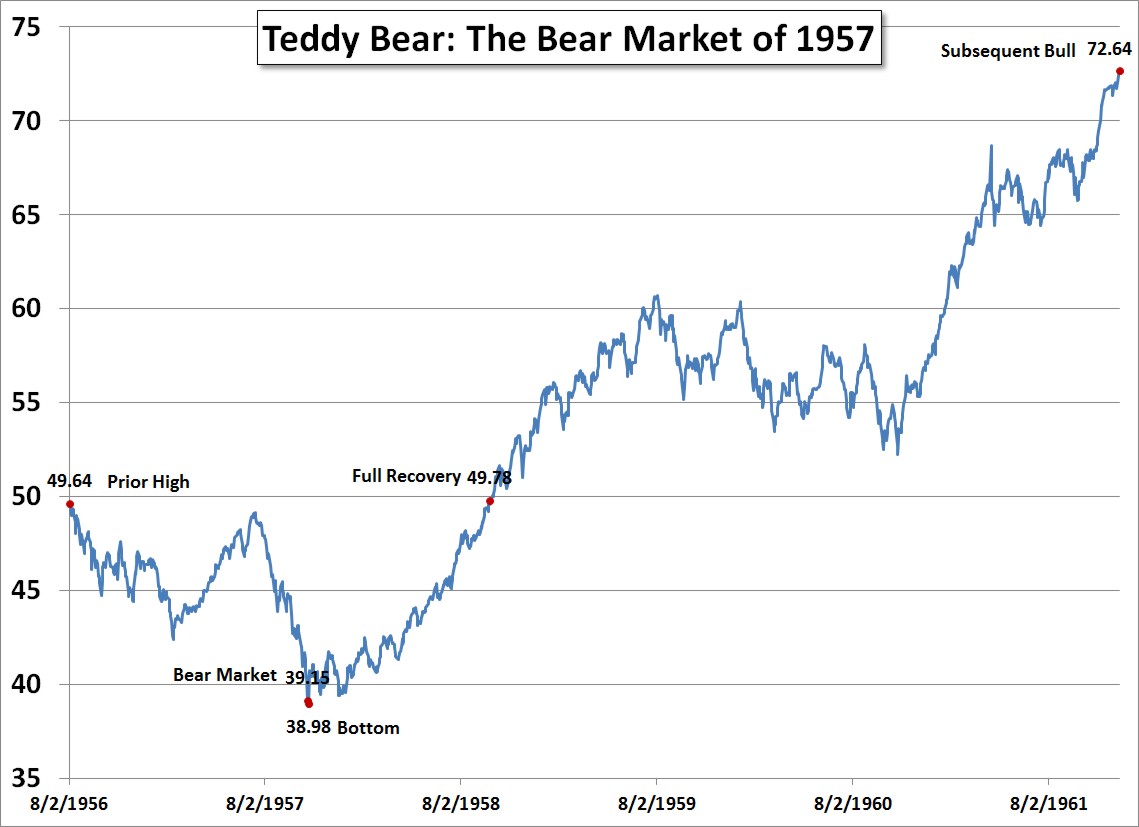
Teddy Bear: The Bear Market of 1957
On 10/21/1957, the S&P 500 Price Index dropped to 39.15, down -21.13% from its prior high on 8/2/1956. The market had been dropping for 445 days (1.2 years). It bottomed 1 day later on 10/22/1957 at 38.98, down -21.47%.
Over the next 70 days (2.3 months), the S&P 500 Price Index rose and then dropped below the -20% mark another four times.
After bottoming, the market fully recovered to its prior peak just 337 days (11.2 months) later on 9/24/1958.
The entire cycle lasted 783 days (2.1 years), 446 days from prior peak to bottom and 337 days back to the prior peak. After recovery, the market continued its upward trend for an additional 39 months (3.2 years).
The total 50 month (4.1 years) bull market ultimately peaked on 12/12/1961 at 72.64, up 86.35% from the bottom of the bear market. During the total recovery from the bottom, the markets experienced an annualized return of 16.23%.

Because it just dipped below -20% and then accelerated into a recovery more rapid than the drop which lasted over three times longer has caused some to refer to this Bear Market as a “teddy bear.”
Here are five important lessons:
1. If you were withdrawing from your portfolio, having a bond allocation helped. You only needed to have saved 2.1 years worth of spending in a bond portfolio in order to weather the whole Bear Market back to full recovery. We recommend having 5-7 years of safe spending in stable fixed income investments like bonds. The value of not running out of money when making withdrawals cannot be measured. That is why the optimum asset allocation is priceless.
2. You can never tell when the market will stop dropping. By the time the market qualified as a bear market and was down more than -20%, there was just one more day until the market bottomed. In the middle of the Financial Crash of 2007 it seemed like the market would never stop dropping, but they always do.
3. Drops in the market are buying opportunities. Any purchases between the prior high and the full recovery had nice gains when it was over. Rebalancing your portfolio results in exactly the right amount of strategically-timed buying.
4. The markets don’t move in a straight line. Nothing is clean about the stock market movements in this time period. After the prior high, there was a rally which peaked on 7/12/1957 before falling sharply to the bottom. And after the full recovery, the markets had over a year (8/3/1959 to 10/25/1960) when they slid jaggedly downward before rallying sharply up. You should never presume that because the markets have gone down (past tense) that they are going down (present tense). Similarly, you should never assume that because the market have gone up that they are going up. Past market movements have no correlation to future returns.
5. There is no one cause of a bear market. Historical narratives don’t provide any explanatory power or insight. On 7/21/1957, Dwight D. Eisenhower announced a 2-year suspension of nuclear testing. On 7/28/1957, Senator Strom Thurmond (D-SC) set the record for the longest filibuster with his 24-hour, 18-minute speech railing against a civil rights bill. On 9/4/1957, Governor Orval Faubus (D) of Arkansas called out the National Guard of the United States to prevent African-American students from enrolling in Little Rock Central High School. On 9/9/1957, The Civil Right Act of 1957 passed with 91.7% of Republicans and 54.0% of Democrats supporting it. President Eisenhower signed it into law. On 9/24/1957, President Dwight D. Eisenhower addressed the nation and sent federal troops to Arkansas to provide safe passage into Little Rock Central High School for the “Little Rock Nine” . On 10/4/1957, The Soviet Union launched Sputnik 1.
This is all interesting history, but there are always months worth of history happening every year. Some of it coincides with the stock market going up or down. Very little of it offers any wisdom for investing. The market drops when there are more people selling stock than those wanting to buy stocks. That is how a market is made. We look for narratives which provide predictive power even when there is no such cause and effect. We would do better to assume that no such simplistic cause and effect exists.
Each Bear Market has its own unique statistics, but it is helpful to see with 20/20 hindsight what lessons they might suggest. They may be unpredictable, but they need not cause us distress.
Photo used here under Flickr Creative Commons.