Recently, I received an advertisement for a proprietary stop loss and re-entry methodology.
Calling it a “proprietary” methodology is a red flag. It violates Safeguard #5: Understand Your Investment Strategy.
In that article I admonish:
Don’t trust any investment strategy you don’t understand, and don’t trust any advisor who won’t or can’t take the time to explain exactly why and how he or she operates. An advisor’s investment philosophy is the most important and valuable resource you are purchasing. If you don’t trust your advisor’s knowledge and techniques, you shouldn’t entrust your financial future with them. In other words, don’t invest in anything with anyone that you either do not understand or with whom you feel uncomfortable. …
Note that I am not advocating “invest in what you know,” which is called familiarity bias and can cause your portfolio to be inadequately diversified. Only investing in what you know may help you avoid some crazy investment schemes, but the resulting concentration can be dangerous in other ways.
Instead, the better rule of thumb is “know what you are investing in,” which requires active participation by both you and your advisor. It is best to have an advisor who is a patient and skilled teacher or mentor at heart. And to be a good coach, your advisor should be willing to contradict you when it will help you better meet your goals. At the end of the day, your coach will still be your coach, but you should also be a better player as a result of the relationship.
In the case of this ad, the advisor did have a section where they gave some clues as to their philosophy. In one section of an 11-page brochure they explained:
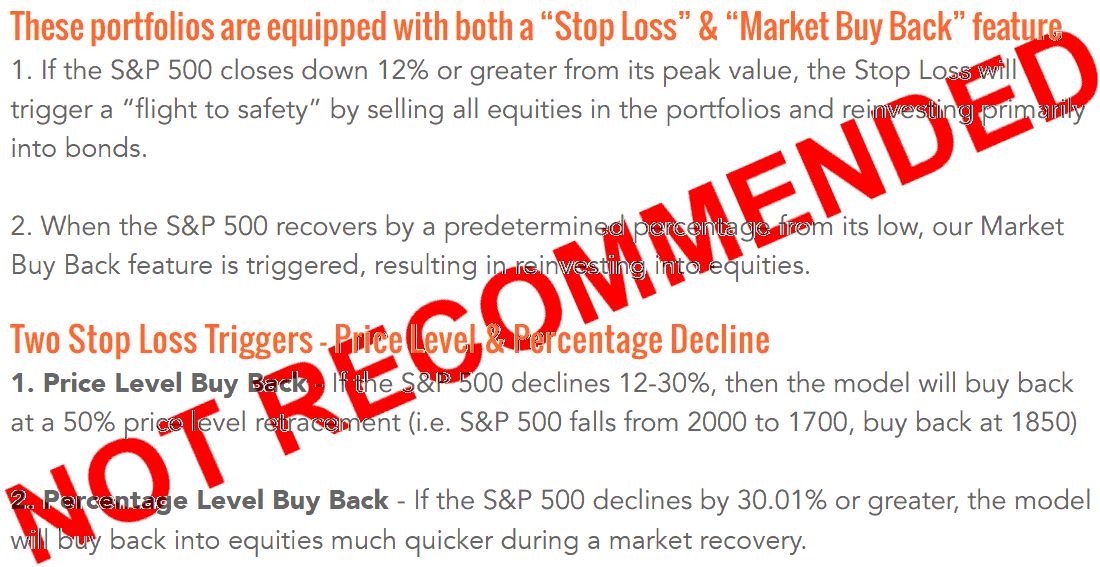
This advertisement leaves out some important metrics. First, many years have intra-year declines and yet end the year with positive returns. The average intra-year decline is about 13.8%, meaning that almost every year you are going to experience a “flight to safety” by selling all equities in the portfolio and reinvesting primarily in bonds. This kind of movement is hoping that all market downturns greater than 12% are greater than 24%. Any downturn between those numbers will lose money.
This trading strategy appears determined to lose more money than the markets in normal circumstances.
For example, on August 25, 2015 you would have gotten out of the market as the S&P 500 slipped to -12.35% from a prior high. You would have been out of the markets until October 8, 2015 when the market recovered to -5.51%, less than half of its prior drop. I don’t know what you would have done when the market then reversed course dropping to -14.16% on February 11, 2016. Would their proprietary trading strategy have sold again or stayed invested?
Then again in the Near Bear Market of 2018, you would not have gotten out of the markets until December 17, 2018 when the market finally dropped to -13.13%. Then, you would have stayed out of the market until January 18, 2019 when the market recovered to -8.87%, only to drop back down the next day.
In both of these examples, you would lose more money than by just staying invested. But how would it have fared in a deep market drop like what we experienced in 2008?
On January 16, 2008 the market dropped to -12.26% from a prior high. This would have triggered their “flight to safety” and gone to all bonds. The market was ultimately down -18.64% on March 10, 2008. By May 15, 2008 the markets had recovered to -9.05% (less than 50% of the prior drop) and would have trigger the “market buy back” and reentered the markets. All of this occurred months before the October drops and financial bankruptcies. From this point only they know what they would have done. Is reentering the markets a final decision or can you get back out again? And if you get back out again does it require an additional 12% drop in order to trigger such an event? And what is the reentry point for such an event?
This strategy also ignores the complexity of getting out of the market. On May 6, 2010, a flash crash occurred when stop loss orders were triggered and there were no buyers because the market makers had backed off from the market. Many stocks, trading for over $100 at the start of that day, sold for just pennies. By the end of the day they were back to over $100. Stop loss orders make you do the exact opposite of what you should do. This is one reason why in February 2016 the New York Stock Exchange stopped taking stop loss orders.
These examples show how this kind of strategy frequently results in selling low, buying high, and losing money.
The ad brochure has contradictory statements, which both acknowledge this downfall and promote the strategy, writing:
During a market correction, many investors don’t sell their equities soon enough and often wait too long to reinvest into equities as the market recovers. …
Emotional and behavioral drivers are notorious for pushing many individual investors into poor results. All investors like to buy low and sell high, but as the following chart illustrates, this does not happen for many investors, who must instead suffer the consequences of buying high and selling low. Capital appreciation is an important part of investing, but of equal or greater importance is reducing losses. …
Stop loss strategies, including ours, will not always get it right. Not every 12 percent loss signals a would-be catastrophic market or stock decline. It is important to remember the power of losses, percentage of decline, and time it takes to fully recover could be catastrophic for those in or near retirement, especially if you are taking withdrawals from your investments during a correction period.
Yes, emotional investing is a poor idea, but this strategy of jumping in and out of the markets is often buying high and selling low.
A 12% loss is part of normal market movements. The market is often under some prior high. If it wasn’t, it would be setting new record highs every moment. Getting out of the markets is the emotional investing we should avoid.
It is interesting that when the market experiences a drop of greater than 30%, the model buys back into equities much quicker. This is because the lower the market falls the more important it is to stay invested. Failing to get the return when the markets drop greater than 30% would be terrible. You would lose much of the value of the markets. However, it isn’t clear what their metric is for reentering the markets after a 30% loss of value.
I called the company and asked for more information. I suspected that something was amiss before calling. Their website had almost no information on it. The person who answered the phone said that they don’t like to give away their “secret sauce,” another red flag. But he did send me three fact sheets. Here is what I learned from their fact sheets.
This strategy’s inception date was April, 2014. The fund has just over six years of experience. Its five-year cumulative return as of May 2020 was 25.50% compared with its benchmark, the S&P 500, which had a return of 60.00% (as of May 31, 2020).
Everything prior to April, 2014 is hypothetical back tested performance. Their small print warns, “In fact, there are often sharp differences between hypothetical performance results and the actual results subsequently realized by a client’s portfolio.”
And the chart, titled “hypothetical back tested performance 4/1/98-5/31/20” shows how the portfolio would have earned more than the S&P 500. During that time, there are only a few times when the market was down more than 30%. The Dot Com Bubble and the Financial Crisis of 2007-2008.
With most charts, the starting date is more important than the ending date. This starting date was likely chosen to eliminate the drops during the 1990s which could have triggered a “flight to safety” while still experiencing the two major drops over 30%.
With two examples of when to get back into the markets, it is not difficult to devise a strategy which works perfectly for those two situations. It looks as though the drops have very little effect on the portfolio, and that reentry to the markets is near the bottom. Such back tested results are not difficult to create such a scenario. And having found a strategy which works historically doesn’t suggest that it would work again.
An additional error in the analysis is that their strategy involves investing 100% in the Guggenheim’s S&P 500 Equal Weight ETF (RSP). This exchange-traded fund has an inception date of 4/24/2003. It currently has an expense ratio of 0.20%.
RSP is not an S&P 500 fund. It is an S&P 500 Equal Weight fund, meaning that instead of the fund being concentrated in the top few holdings weighted by their capitalization, the fund is equally weighted among about 500 companies.
RSP generally does better than the S&P 500. For this reason, simply choosing RSP over the S&P 500 should have given this proprietary strategy an advantage. It is unfair to compare a strategy of jumping in and out of an equal weight fund which takes on more risk to a buy and hold of the S&P 500. This is another misleading part of this fund’s presentation.
Finally, they were charging a 1.9% fee, not for investment management but simply for the guideline of when to get back into the markets after a 30% loss.
Such strategies sound too good to be true and can be avoided by this concern alone. That being said, hopefully this piece gives you the confidence to avoid such strategies in the future.
Latest posts from David John Marotta
- #TBT A Review of Finances at Age 60 - July 25, 2024
- #TBT Implement the Automatic Millionaire at Schwab - July 18, 2024
- #TBT Stress Is Not Your Enemy - June 27, 2024