It’s difficult to name a sector with more active narratives at any point in time than Energy. Peak Oil fears, concerns about global demand, short-term price movements, and the price at the pump when filling up your car clouds the mind of even the most disciplined investor. In short, the Narrative Fallacy is alive and well with Energy.
We recommend investing in the stocks of Energy companies over and against MLP’s or oil futures (in fact, our firm’s fourth principle for safeguarding your wealth would lead investors away from oil futures). Energy stocks present investors with an interesting mix of characteristics since your equity is in the fully-integrated business of extracting, refining and selling energy rather than simply speculating on what can be harvested from the Earth. Many investors fear that alternative energies will displace these companies and fear for their portfolios as a result. This same fear no doubt drives energy companies themselves since their entire firm is at risk, and it should be no surprise that an investment in Energy companies is often an investment in the leading research for tomorrow’s renewable energy sources.
Energy stocks have historically yielded excellent average returns but with substantial volatility. The “boom or bust” nature of energy prices can scare some investors away from these stocks. Our 2016 “Gone Fishing” portfolio even includes a 16% portfolio allocation to Energy stocks.
The MSCI US Investable Market Energy 25/50 Index is one of many broad-based indices for US Energy companies, and it is the baseline for our firm’s preferred Energy ETF: the Vanguard Energy Index Fund (VDE). The fund is more top-heavy that most with over 35% of its holdings in the top two companies, and 50% of its holdings concentrated in top five companies. The ETF has an expense ratio of 0.10%, which is lower than the 0.46% category average for ETFs in this sector.
The fund’s top holdings (as of 10/10/2016) are:
| 1 | Exxon Mobil Corporation | 22.77% |
| 2 | Chevron Corporation | 12.58% |
| 3 | Schlumberger NV | 7.33% |
| 4 | Occidental Petroleum Corporation | 3.94% |
| 5 | ConocoPhillips | 3.37% |
| 6 | EOG Resources, Inc. | 3.28% |
| 7 | Kinder Morgan Inc Class P | 2.76% |
| 8 | Phillips 66 | 2.54% |
| 9 | Halliburton Company | 2.50% |
| 10 | Pioneer Natural Resources Company | 1.98% |
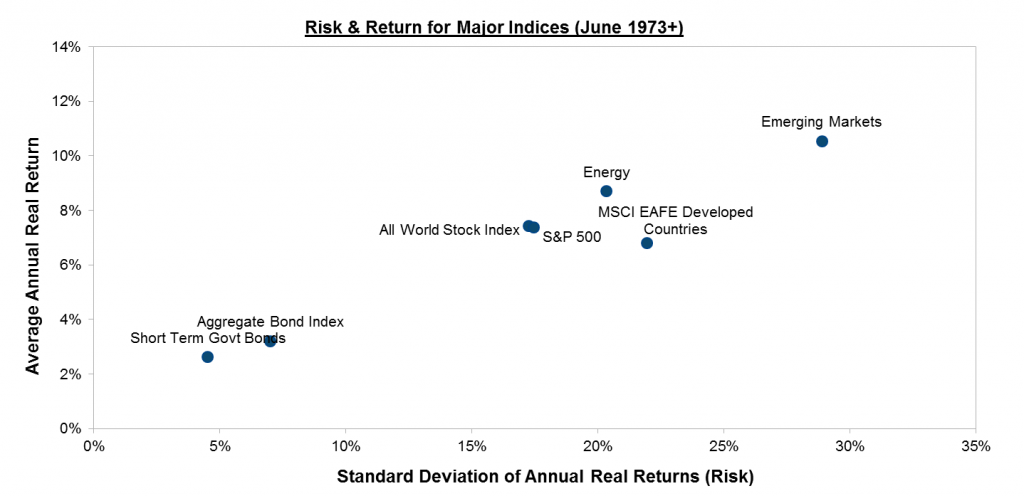
Since June 1973, Energy has had an average real return of 8.70% per year (beating the S&P 500’s average real return of 7.42%), but with meaningfully more volatility in returns: Energy had a standard deviation of 20.35%, compared to 17.25% for the S&P 500. Statistically, this means that approximately two thirds of years will yield real returns between -11.65% and 29.04%. Over that period the trailing twelve-month real returns were negative over 30% of the time, but they were also positive in excess of 20% for over 28% of twelve-month periods. The “boom or bust” perception isn’t altogether unfounded.
Energy’s position as a higher-return and higher-risk asset compared to the All World Stock Index and the S&P 500 means it can boost returns in a market cap-weighted portfolio.
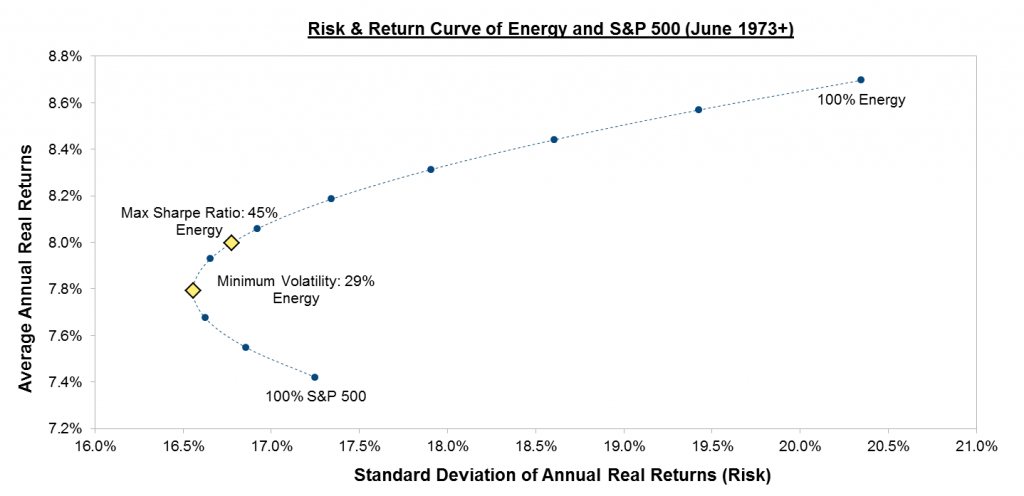
The beauty of incorporating Energy stocks into a portfolio is that it has historically generated a more efficient mix than could be had simply by invested in a well-known index of equities. What sets Energy apart is its low correlation with the S&P 500 (62%), even taking into account that the second largest holding in the S&P 500 is an Energy stock (Exxon Mobil). This low correlation means that investors concentrating on the S&P 500 can actually boost returns and reduce risk simply by over-weighting Energy stocks. In fact, the lowest-risk mix (historically) has been a portfolio mix that is nearly one-third Energy stocks.
| S&P 500 | Energy | Max Sharpe Ratio Portfolio | Minimum Volatility Portfolio | |
| Return | 7.42% | 8.70% | 8.00% | 7.79% |
| Risk | 17.25% | 20.35% | 16.77% | 16.56% |
| Sharpe Ratio* | 0.43 | 0.43 | 0.48 | 0.8 |
| Energy (%) | 0% | 100% | 45% | 29% |
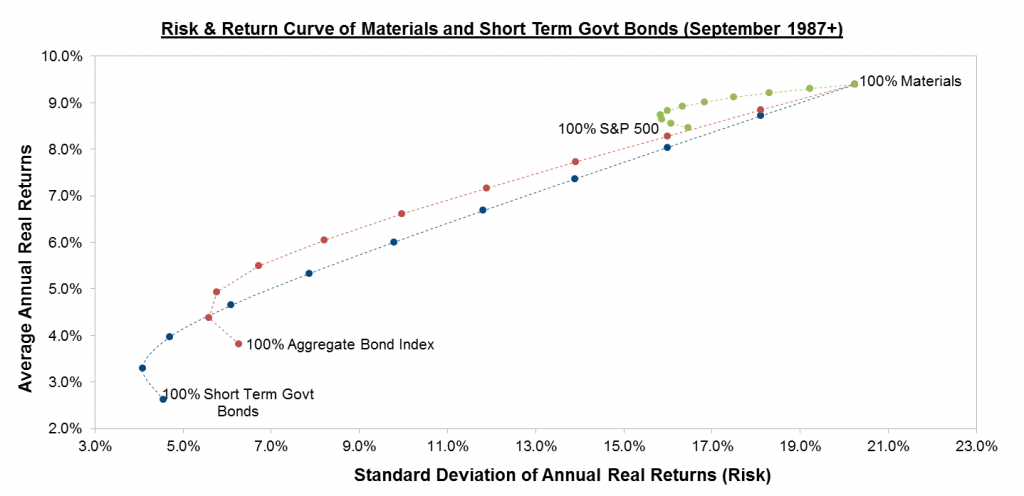
Energy’s low correlation with nearly every other major asset class means even very conservative investors should consider over-weighting Energy stocks, because the same effect holds true when compared with Short Term Government Bonds or the Aggregate Bond Index.
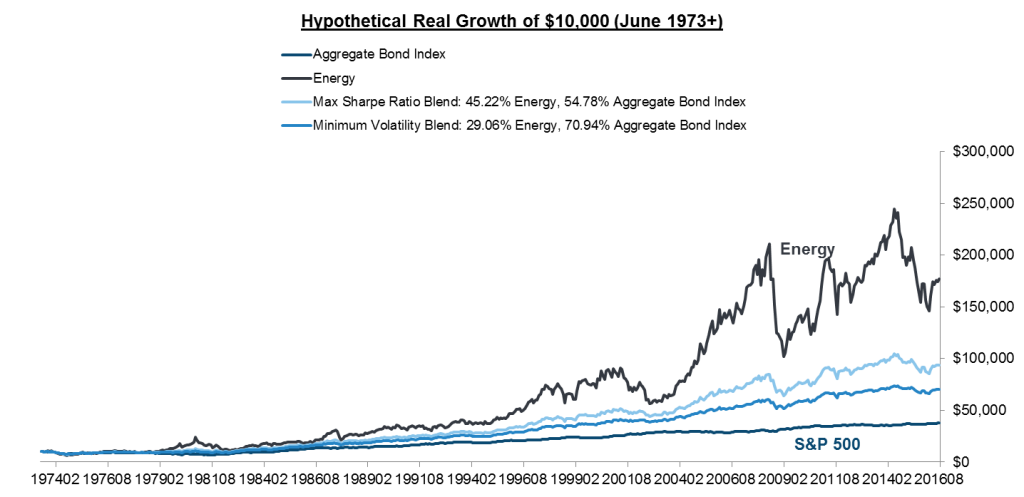
Energy’s apparent ability to add value to nearly any asset class in portfolio construction is due to its lack of correlation with other major indices: historically, the sector has had a -26% correlation with Short Term Bonds, a -2% correlation with the Aggregate Bond Index, and a 40%-50% correlation with major stock indices. How do Energy stocks have such a low correlation with other assets? They are simultaneously an inflation hedge in inflationary periods, and a fully-functioning business in non-inflationary periods. Over the long-term, this means investors would have generated a nearly equivalent return with far less volatility by incorporating Energy stocks into their portfolio.
The most natural question to ask about Energy is “When.” Should I invest in Energy now, or wait until a price drop to “catch a falling knife”? We’ve written about the unpredictability of oil prices before, and current-day oil spot prices are generally a poor indicator for short-term sector returns. Instead, investors should follow a disciplined, periodic rebalancing strategy. Energy is a sector that benefits from this particularly well. Historically, Energy returns revert back to their mean returns somewhat neatly. In fact, this pattern has been more well-behaved in Energy than the S&P 500 even though it is a more volatile sector to invest in.
This mean reversion means low past returns in Energy are generally followed by strong future returns, and vice versa. This is no guarantee, but it means that buying after terrible performance–though painful–is wisest, as is trimming after a banner year. But we all know this: it’s simply buying low and selling high. Energy is a textbook case of an asset class where investors are best-served by setting a target allocation to hold in all environments and simply buying or selling to rebalance back to that target.
We always acknowledge that we don’t know what the future holds, but with history as our guide we seek to build portfolios that maximize the probability of success, even when the answer is not intuitive. Those seeking more risk can set an allocation to Energy and periodically rebalance to take advantage of the wild fluctuation between up years and down years. Those with large fixed income holdings may even want a sizeable allocation to Energy to act as an inflation hedge and to decrease portfolio risk. Loss Aversion is a powerful psychological phenomena, and an allocation to Energy will mean that one will encounter losses. We think, on balance, that adding this diversity will benefit investors’ portfolios.
Notes: Past performance is not a guarantee of future returns. Top holdings information from ETF.com. Sector average expense ration from ETFDB.com. Foreign Stock index uses MSCI EAFE Index through 12/2015 and Deutsche CROCI World Index for 2016+. Risk-free rate assumed to be 0% for Sharpe Ratio calculations. Minimum volatility and Maximum Sharpe Ratio portfolios based on proprietary analysis of past returns and volatility. Index data defined as follows: Short Term Bonds: Barclays 1-3 Year Government Index (1/1976+); Aggregate Bond Index: Putnam Income Fund A Shares (12/1954-12/1975), Barclays Intermediate Aggregate Bond Index (1/1976+); S&P 500: Ken French US sector data (7/1926-12/1969), S&P 500 Composite Total Return (1/1970+); All World Stock Index: MSCI All World Index (1/1988+); MSCI EAFE Developed Countries: MSCI EAFE Developed World Index (1/1970+); Emerging Markets: Average of MSCI EM Europe and Latin America indices (1/1988-12/1993), Lipper Emerging Markets Funds IX (1/1994-12/1998), MSCI Emerging Markets Index (1/1999+); Energy: Ken French Oil sector data (7/1926-1/1991); Dow Jones US Oil & Gas Total Return Index (2/1992-12/1998); SPDR Energy Select Sector (1/1999+)Real returns calculated based on CPI index.
Photo used here under Flickr Creative Commons.


