 The second quarter of 2020 was the fourth best quarter since 1950 and the best quarter since 1998. It is one of the reasons why it is said, “You make most of your money in a Bear Market; You just don’t realize it at the time.”
As I showed in a previous article, the lower the market falls, the more important it is to stay invested. A recovery after a significant downturn in the markets is often marked by steep growth. If you sell and flatline, you will likely miss the market’s natural recovery and thus your own personal future recovery becomes very difficult.
Now that we’ve seen those steep returns and are almost all the way recovered, some investors have been taking money out of the markets. This strategy, known as “selling the bounce,” is normally an unwise decision.
To demonstrate that fact, I gathered the S&P 500 Price Index monthly returns from December 30, 1927 to July 7, 2020. Then, I calculated the rolling return of the past 93 days compared to the rolling return for the next year. This created 22,923 rolling periods of prior 93-day returns and subsequent 1-year return pairs.
Then, I grouped the data pairs into 10 groups by the previous quarter’s percent growth and calculated the average return of the next year. A full 27.33% of the 93-day returns fell into the group representing a prior quarter’s return of 0% to 5% and 87.30% of the 93-day returns in the midsection of greater than -10% and less than 15%.
In contrast, only 12.70% of the 93-day returns fell at the tails of less than -10% and more than 15%.
The average 93-day return over this time period was 1.91% while the average 1-year return was 7.59%. The 93-day standard deviation was 9.83% while the 1-year standard deviation was 20.10%.
The average 1-year returns graph as follows: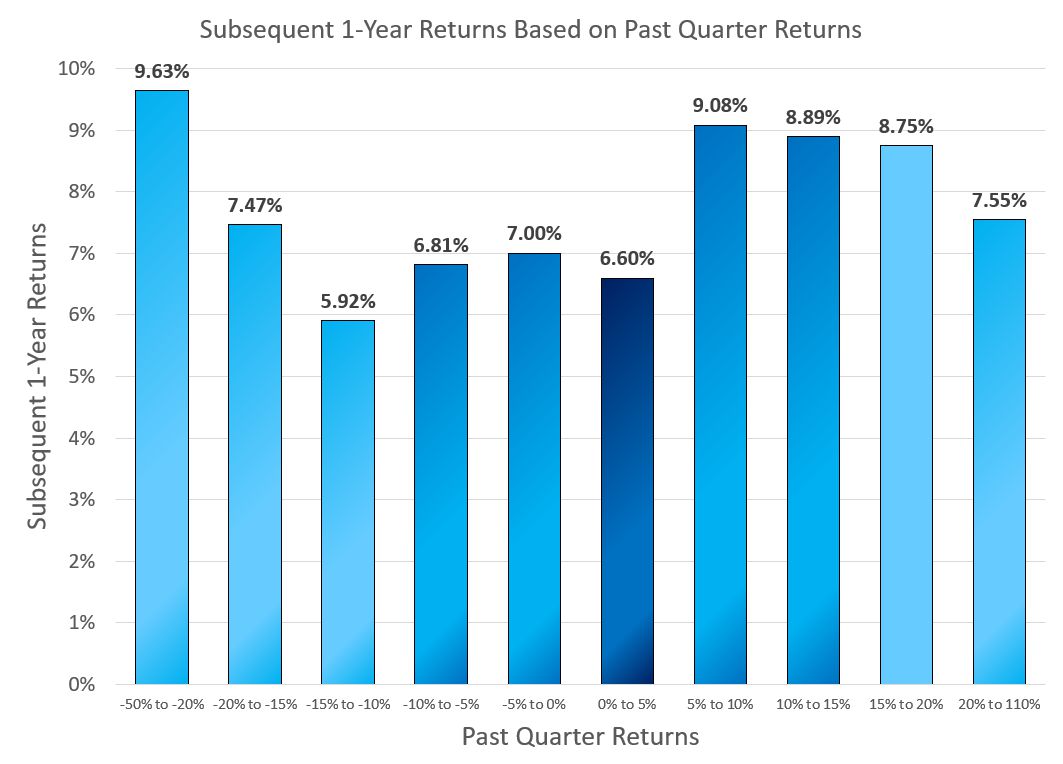
You can see visually from this graph how both positive and negative volatility in one quarter had above average returns over the next year. In the 1,031 cases (4.50%) where the prior quarter was up more than 15%, the overall average subsequent one-year return was 8.27%. Similarly, in the 1,881 cases (8.21%) where the prior quarter was down more than -15% the average subsequent one-year return was 8.21%.
When the past quarter was volatile (down more than -15% or up more than 15%), the average return of the next year was higher than the overall average.
In contrast, when the past quarter was between -15% and 15%, the overall average subsequent one-year return was 7.51%, showing a subsequent one-year return that is slightly below the 7.59% average.
This data shows that there is no historical justification for selling to cash during volatile market movements. If anything, the data available justifies investing more during volatility.
Better still though is to simply remain calm and rebalance. If market volatility makes you question getting out of the markets, don’t peek or get a financial advisor who will talk you into staying invested.
Photo by Joseph Greve on Unsplash
Latest posts from David John Marotta
- How To Distribute from A College America 529 Plan to an Account Owner - October 22, 2024
- #TBT Are Democrats Or Republicans Better For The Stock Market? - October 17, 2024
- How To Distribute from A College America 529 Plan to a Designated Beneficiary - October 15, 2024