
A gone fishing portfolio is a portfolio of just a few stocks which should weather the ups and downs of the market fairly well while only rebalancing twice a year. We recommend a gone-fishing portfolio for small accounts of people who are getting started with investing. For those with larger accounts or those who are approaching or in retirement, we recommend professional management. For that reason, our calculators do not make recommendations beyond age 70.
This year we are offering three different gone fishing portfolios. In addition to updating our traditional Gone Fishing Portfolio and our Vanguard Mutual Fund Gone Fishing Portfolio, we are adding a Schwab No Transaction Fee Gone Fishing Portfolio.
You can find all three calculators here:
- Marotta’s 2017 Gone-Fishing Portfolio Calculator
- Marotta’s 2017 Vanguard Gone-Fishing Portfolio Calculator
- Marotta’s 2017 Schwab Gone-Fishing Portfolio Calculator
Marotta’s 2017 Gone-Fishing Portfolio

Each year, we use the Age 40 Asset Allocation (85.4% stocks and 14.6% bonds) for performance comparison. During 2016, this portfolio had a return of 12.23%. By comparison, the all-stock S&P 500 had a return of 11.96% and the more appropriate 15% Stability / 85% Appreciation benchmark had a return of 7.28%.
The additional returns came from including resources stocks such as iShares N.Amer Nat Recourses (IGE) which had a 30.16% return, tilting small and value which performed well, and a foreign stock strategy of Freedom Investing.
In 2017, we have changed two of the securities.
First, we have substituted Vanguard Energy ETF (VDE) in place of the iShares North American Natural Resources ETF (IGE). Both funds did well last year with VDE appreciating 29.56%. IGE did slightly better partly because it has a little bit more metals and mining which had a great year in 2016. We’ve been analyzing the different resource stock categories and have decided that weighting materials (metals and mining) may not be part of the efficient frontier for most portfolios. Materials is more volatile than energy and historically has a lower mean return. For this reason we have decided to replace IGE, a resource mix, with VDE, a pure energy fund. Additionally, while IGE has an expense ratio of 0.48%, VDE’s expense ratio is only 0.10%.
The second change we are making is to replace Pimco Total Return (PTTDX/PTTRX) with Schwab U.S. Aggregate Bond ETF (SCHZ). The main factor was the desire to reduce expenses. The expense ratio of PTTRX is 0.47% and of PTTDX is 0.76%. Meanwhile, the expense ratio of SCHZ is only 0.04%. PTTDX usually has no transaction fee to buy or sell, but PTTRX usually has a fee between $25 and $50. SCHZ on the other hand has no transaction fee on the Schwab platform. The 2016 returns for all these funds were fairly similar. PTTRX’s 2016 return was 2.60% compared to SCHZ’s 2.49%. Meanwhile PTTDX had a return of 2.30%. We did not think that PTTRX would justify its additional costs in the coming years.
Marotta’s 2017 Vanguard Mutual Fund Gone-Fishing Portfolio

While the traditional gone fishing portfolio had a return of 12.23% during 2016, the Vanguard Mutual Fund Gone Fishing Portfolio’s return was 11.12%. Both portfolios outperformed their 15% Stability / 85% Appreciation benchmark which had a return of 7.28%. The difference in returns was due to a couple of factors.
While IGE had a return of 30.16%, VGENX’s return was 27.66%. Additionally in the Vanguard Gone Fishing Portfolio, we use Vanguard Developed Markets Index Fund Investor Shares (VDVIX) as the foreign developed markets. This fund has a 2016 return of just 2.29%. Vanguard does not have funds which can target foreign investing to just those countries high in economic freedom. We believe this limitation of the choices at Vanguard explains some of the lower returns.
Because the Vanguard Gone Fishing Portfolio does not have country specific funds, it used just 8 different funds last year.
This year we are splitting the bond allocation to include foreign bonds using the Vanguard Emerging Markets Government Bond Inv/Adm (VGOVX/VGAVX) mutual fund which is the equivalent of the Vanguard Emerging Markets Government Bond ETF (VWOB) exchange traded fund.
Also, we added a new feature to the calculator; we are including the ticker symbols for both the Investor class of mutual fund shares along with the Admiral class, which has a slightly lower expense ratio.
Marotta’s 2017 Schwab No-Transaction Fee Gone-Fishing Portfolio

Normally our traditional Gone Fishing Portfolio is comprised of exchange traded funds (ETFs) which are bought and sold like stocks. Many of these have a transaction fee to buy or sell them. The transaction fee is often between $4 and $9 at most discount brokers. Schwab has just lowered their fee to $6.95. Each broker has a different transaction fee to buy and sell stocks, and each broker also often has a list of ETFs for which they waive the transaction fee. Schwab has over 200 funds as part of their Schwab ETF OneSource. This year we have crafted the best gone-fishing portfolio we can using just these funds.
Many of these funds have very low expense ratios and we use them in our traditional Gone Fishing Portfolio. Others have a slightly higher expense ratio, but still low enough to be very inexpensive.
As an example, in our traditional Gone Fishing Portfolio, we use the Vanguard Mid Cap Value ETF (VOE) and the Vanguard Small Cap Value ETF (VBR) both with an expense ratio of 0.08%. Both of these funds currently cost $6.95 to buy or sell at Scwhab.
In our Schwab No-Transaction Fee Gone-Fishing Portfolio, we have substituted in the SPDR S&P 400 Mid Cap Value ETF (MDYV) and the SPDR S&P 600 Small Cap Value ETF (SLYV) both with an expense ratio of 0.15%. Neither of these funds currently cost anything to buy or sell on the Schwab platform.
Assuming that these funds were identical to their Vanguard counter parts, a year’s worth of the extra 0.07% expense would equal the $6.95 transaction cost if you were purchasing $9,929. For most investors with portfolios under $200,000 this makes the no-transaction fee funds a better choice. For very large portfolios where the individual component purchases are large, the traditional gone fishing portfolio might be preferable.
If you are already using the traditional gone fishing portfolio and have already purchased VOE and VBR there is no reason to sell these positions. Selling them would incur the $6.95 trading costs. Instead you can use MDYV and SLVY to add small amounts to these positions as you save more money. We call this our rock and sand technique. Having large positions (rocks) with very low expense ratios keeps the bulk of your portfolio with low fees and expenses. Having smaller positions (sand) which you can buy or sell for no transaction costs keeps your trading costs low.
The no-transaction-fee funds are useful even if they were exactly the same mix of stocks, but they are not. The no-transaction fee funds (MDYV and SLYV) have a different mix, tilting smaller than the Vanguard funds.
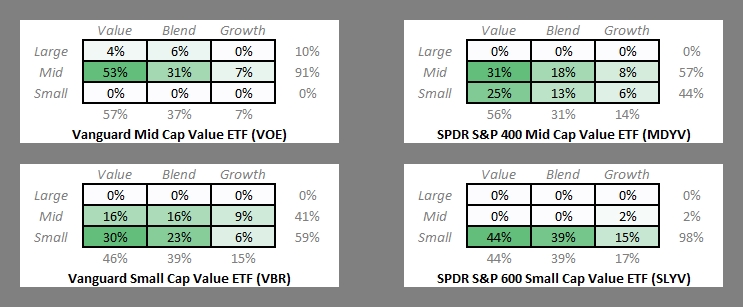
In 2017, small value did better than mid cap value which in turn did better than large cap. As a result of the greater small tilt, the no transaction fee funds did better than their Vanguard counterparts. Last year, VOE had a return of 15.28% versus MDYV’s return of 26.35%. And last year VBR has a return of 24.82% versus SLYV’s return of 31.14%. The greater small-value tilt, on average, experience more volatility and a higher mean return.
There is one small warning for moving toward small value at the beginning of 2017. We use a dynamic tilt between small-value and large-growth to overweight the category with the historically lower forward P/E ratios. Just after the November 2016 election, small value appreciated quickly and turned the ideal tilt back toward large and growth. We do not dynamically adjust any of our gone fishing portfolios. The purpose of a gone fishing portfolio is to set a static asset allocation and then not worry about the markets. This could be a moment in time to under weight small value, but our gone fishing calculators are not going to make those month by month dynamic adjustments. Waiting a few months to implement this change, as a result, could be to your benefit.
Some alternate no-transaction fee exchange traded funds were easy to find. We substituted PowerShares Emerging Markets Sovereign Debt Portfolio (PCY) with and expense ratio of 0.50% for VWOB. Similarly we substituted Schwab Emerging Markets Equity ETF (SCHE) for Vanguard Emerging Markets ETF (VWO), Guggenheim S&P 500 Equal Weight Energy ETF (RYE) for Vanguard Energy ETF (VDE), and Schwab U.S. REIT ETF (SCHH) for Vanguard REIT ETF (VNQ).
I wrote the article “US Large Cap Exchange Traded Fund Choices” to explain our choice of SPDR MSCI USA StrategicFactors (QUS) to take the place of VOO.
The most difficult decision was what to do about foreign developed country stocks. In the traditional Gone Fishing Portfolio, only two of the five country specific exchange traded funds (Australia and Canada) qualify for no transaction fee at Schwab. Freedom did well in 2016. Not wanting to abandon Freedom Investing, I used four countries high in economic freedom with low expenses and no transaction fee at Schwab. They represented Australia, Canada, the United Kingdom, and Germany. All four of these country specific exchange traded funds have a low expense ratio of 0.15% and use a strategic factors approach to investing.
Australia and Canada are high in economic freedom ranking 5th and 7th respectively in the newly released 2017 Index of Economic Freedom. Last year in 2016, SPDR MSCI Australia Strategic Factors ETF (QAUS) appreciated 9.88% and SPDR MSCI Germany Strategic Factors ETF (QCAN) appreciated 22.92%. The United Kingdom has been rising in economic freedom for 12 years since 2005. It is currently ranked 12th, above the United States. Last year the United Kingdom experienced BREXIT and SPDR MSCI United Kingdom Strategic Factors ETF (QGBR) was only down -1.35% for the year. Germany is current ranked relatively high in economic freedom as the 26th freest country in the world and one of the mostly free countries in the Euro. In 2016 SPDR MSCI Germany Strategic Factors ETF (QDEU) appreciated 2.34%.
For those who worry that adding the United Kingdom and Germany with their lower returns will result in the no-transaction fee gone fishing portfolio having lower return, our traditional gone fishing portfolio uses Hong Kong, Singapore and Switzerland instead. These countries had 2016 returns of just 1.35%, 0.70% and -2.50% respectively. Collectively Freedom Investing often does better than the MSCI EAFE Index, but it does so in aggregate not individually. And in 2016 Australia and Canada were two of the biggest winners.
As previously stated, we use the age-40 portfolio to compare returns. That portfolio contains 14.6% Stability and 85.4% Appreciation. The appropriate benchmark to compare against would be an 85.4% MSCI All Country World Index and a 14.6% 30-day Treasury Bills Index. For 2016, that blended benchmark had a return of 7.31%.
All three 40-year old gone fishing portfolios would have exceeded this benchmark for 2016. Last year’s Vanguard Mutual Fund Portfolio had a return of 11.12%. It was the lowest of the three partly because it does not include any Freedom Investing. Last year’s original Gone Fishing Portfolio had a return of 12.23%. Both of these portfolios have been changed slightly, but these are last year’s returns.
The newly created Schwab No-Transaction Fee Gone Fishing Portfolio would have had a return of 14.50%. The over-performance is due primarily to the funds SPDR S&P 400 Mid Cap Value ETF (MDYV) and SPDR S&P 600 Small Cap Value ETF (SLYV) which both tilt smaller than the Mid-Cap Value and Small Cap Value funds in the other portfolios. In general, the smaller the value the better the returns. As we mentioned previously, the 2016 return for MDYV was 26.13% while the returns of VOE and VMVIX were 14.69% and 15.11%. And the 2016 return for SLYV was 31.18% while the returns of VBR and VISVX were 24.12% and 23.79%.
The smaller tilt of the funds in the Schwab No-Transaction Fee Gone Fishing Portfolio will produce a greater volatility which is appropriate for the younger investors for whom the portfolio is designed. Younger investors don’t have account values which justify the $6.95 trading costs and therefore should use the no-transaction fee funds.
Again, if you have a larger account value or are approaching or in retirement, we recommend professional management.
All photos (featured, one, two, three) used here under Flickr Creative Commons.
Latest posts from David John Marotta
- #TBT What Are Normal Market Movements? - April 25, 2024
- #TBT Learning to Live on Your Own - April 18, 2024
- #TBT Frequency Matters More Than Height - April 11, 2024
Latest posts from Megan Russell
- Inherited RMD Update: IRS Waives 2024 Penalties and Delays to 2025 - April 19, 2024
- Freedom Investing in Review (March 2024) - April 12, 2024
- Implement a Savings Waterfall for 2024 - April 9, 2024