
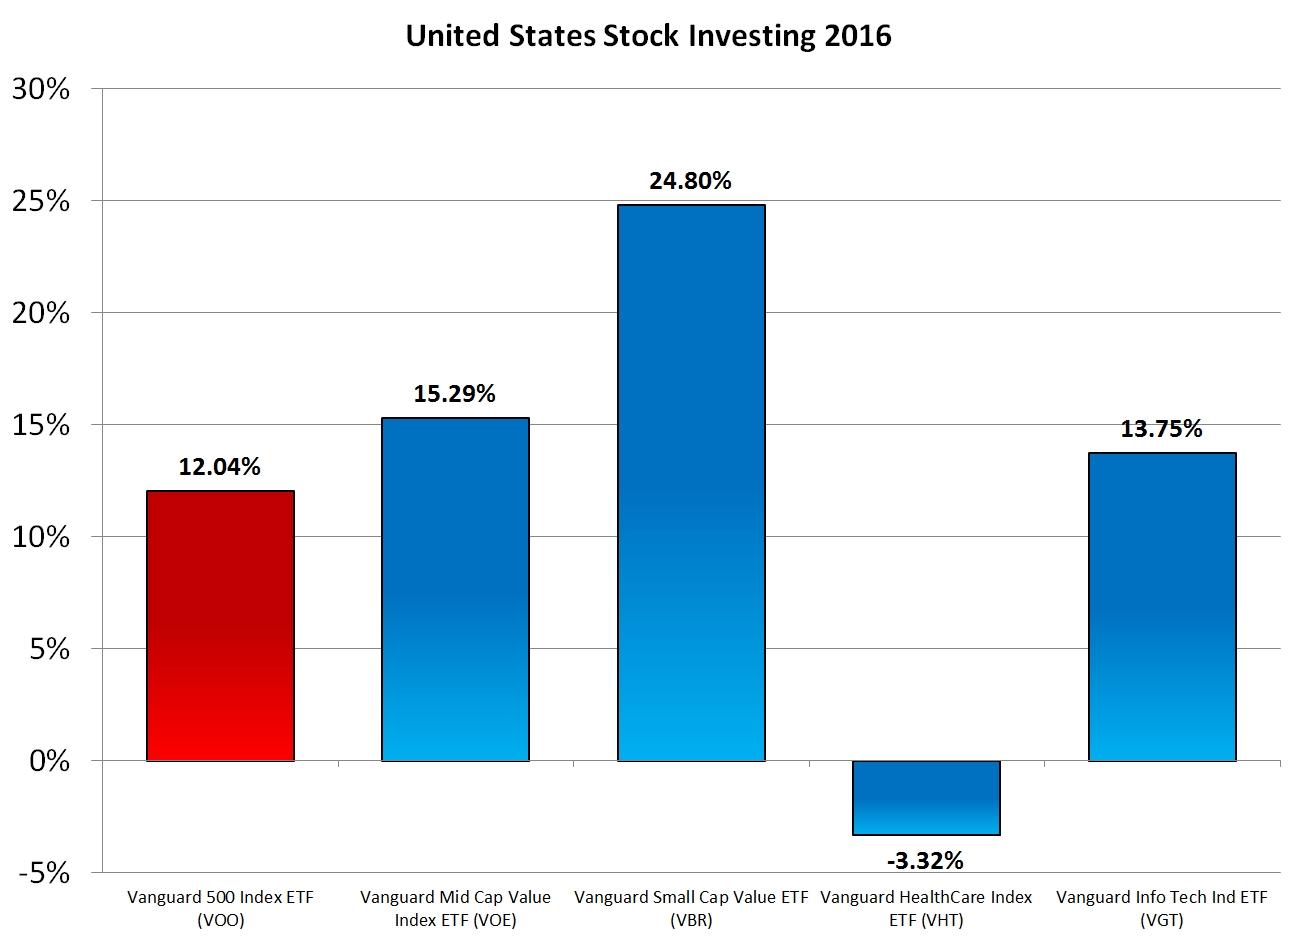
The S&P 500 had another good year, ending up 11.96%. The S&P 500, however, only represents half of the US Stock asset class, and Small- and Mid-Cap stocks performed even better. Here is how five Vanguard index funds that represent sectors of the US Stock asset class fared during 2016:
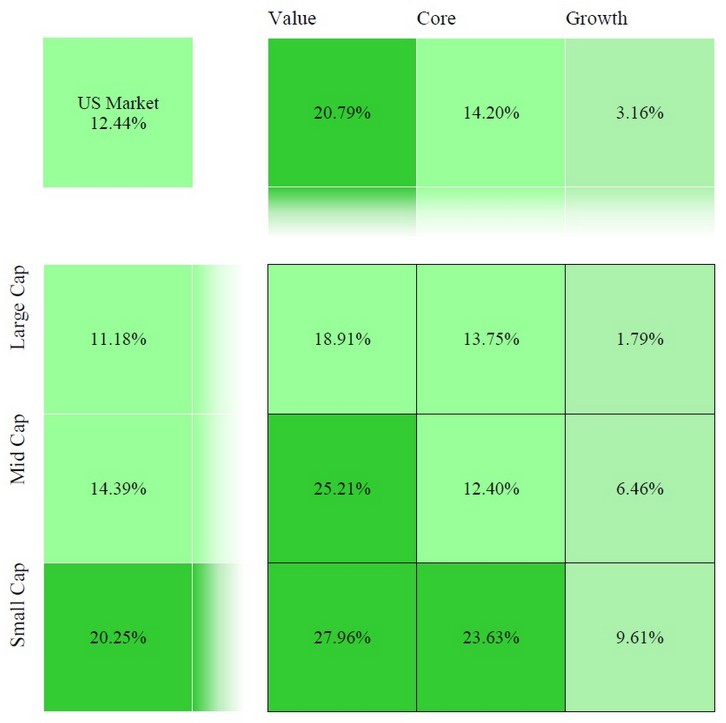
Despite valuations that suggested over-weighting Large-Cap (like the S&P 500) and Value stocks, this year confirmed the bonus to be gained by investing in Small-Cap stocks and tilting toward Value.
You can see the 2016 returns for each of the Morningstar style boxes here (image from Morningstar):
The Vanguard Small-Cap Value ETF (VBR) started to seem reasonably priced when it appreciated by 10.01%, then appreciated by a further 17.95%.
While we still recommend a healthy allocation to Small-Cap Value stocks, going forward, our dynamic trends based on forward P/E ratios suggest tilting slightly Large-Cap and Growth again.
In the article “What Is the Correlation Between Value, Growth, Large and Small Cap Stocks?” we explained that the average correlation between these style-based categories is relatively high, ranging anywhere from 0.75 to 1.00, meaning that the sectors tend to either go up or down together. This year, the correlation was again relatively high with each style box generally moving in the same direction.
There are some sectors that did not fare equally: Cyclicals, Consumer Staples, and Health Care. Here are the returns by sector for U.S. stocks (graph from StockCharts):
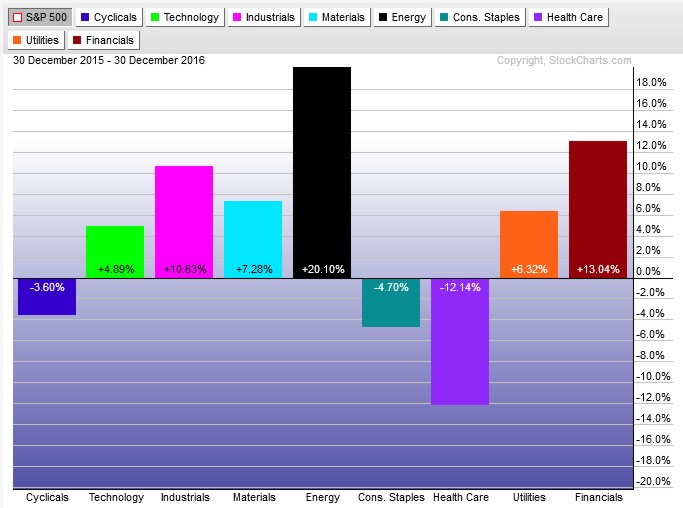
These sector returns are based on the S&P 500 Sector Index Funds. The Vanguard Funds we often recommend listed in our very first chart fared better than these sector funds. And the Vanguard Energy ETF also fared better than the S&P 500 Energy sector.
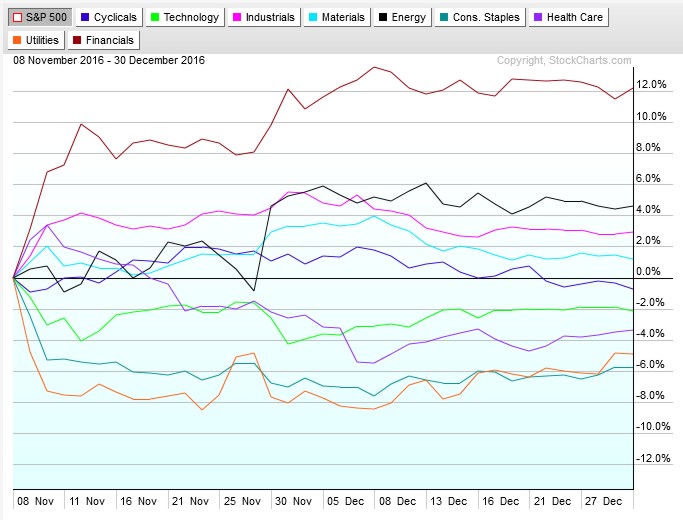
While Energy fared well throughout the year, the Financials sector’s performance largely came after the election. These are the sector returns between Election Day (November 8th, 2016) and the last trading day of the year (December 30, 2016):
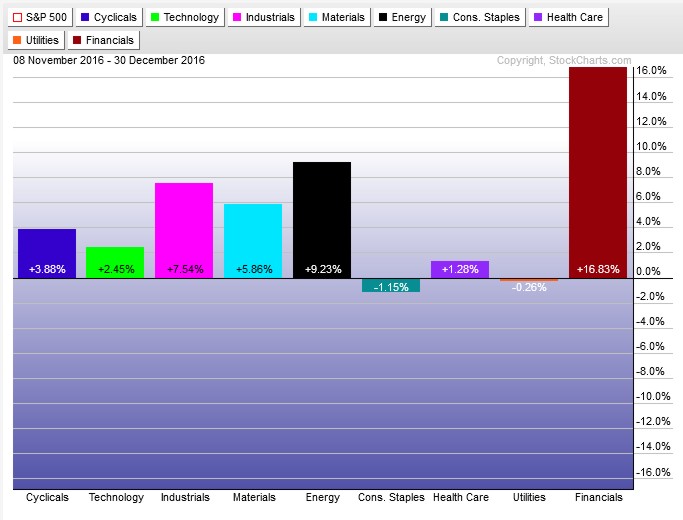
Stocks reacted quickly to the election news but these quick initial movements do not necessarily mean that there is an ongoing trend which will persist. This graph shows just how quickly each sector moved, relative to the S&P 500, after the election:
It is always a good time to have a balanced portfolio. Within each asset class are different sectors that move somewhat independently of each other, have differing levels of volatility, and corresponding different degrees of return. Moving between these in a contrarian manner is the essence of rebalancing wisely, and you can only net the rebalancing bonus if you have a wide array of investments.
Photo used here under Flickr Creative Commons.
Latest posts from David John Marotta
- #TBT A Review of Finances at Age 60 - July 25, 2024
- #TBT Implement the Automatic Millionaire at Schwab - July 18, 2024
- #TBT Stress Is Not Your Enemy - June 27, 2024