Dimensional Funds offers a nice quarterly market review. We use many of their slides in our quarterly mailing. Here is an image from one of the slides that we do not use showing how uncommon average returns are in the S&P 500.
Dimensional Funds explains:
Exhibit 1 shows calendar year returns for the S&P 500 Index since 1926. The shaded band marks the historical average of 10%, plus or minus 2 percentage points. The S&P 500 Index had a return within this range in only six of the past 93 calendar years. In most years, the index’s return was outside of the range—often above or below by a wide margin—with no obvious pattern. For investors, the data highlight the importance of looking beyond average returns and being aware of the range of potential outcomes.
In US dollars. S&P data © S&P Dow Jones Indices LLC, a division of S&P Global. Indices are not available for direct investment. Index returns are not representative of actual portfolios and do not reflect costs and fees associated with an actual investment. Past performance is no guarantee of future results. Actual returns may be lower.

The U.S. stock market has averaged about 10% since 1926. But any given year varies significantly. The markets are inherently volatile, but they have also been inherently profitable. Setting your expectations accurately can help you stay invested long enough to overlook disappointing results and experience the long-term growth you are seeking.
If you are expecting average market returns, only 6 out of the past 93 calendar years have had returns anywhere near the average. That means that over 93% of the time you are going to be disappointed.
But if you are expecting the diversity of returns that we have experienced in the past, you likely will not be disappointed.
How long does it take to receive the average return? So far it has required 93 years to receive the average return. Every additional year changes the averages for the past five, ten, twenty, and thirty years.
Since investors often fear losing money, perhaps a better question is: What is the likelihood of receiving positive returns over various time periods?
Here is another chart from Dimensional Funds Quarterly Market Review answering that question:
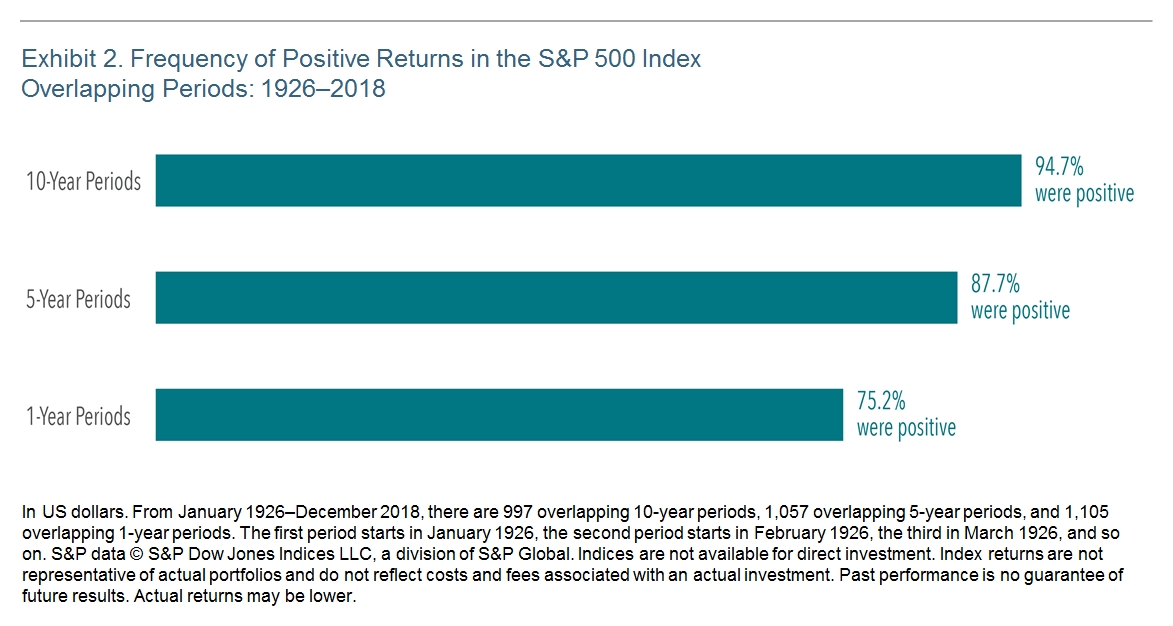
A 75.2% chance of positive returns over the next 12 months means that there is also a 24.85% chance of negative returns. Investors should expect every fourth year to be negative.
Even five or ten-year rolling returns do not guarantee positive returns. Investors who fear negative returns sometimes invest too conservatively and miss growth sufficient to keep up with inflation.
Our philosophy is to have the next five to seven years of spending invested in relatively stable bond investments and to invest the remainder in stocks for the long haul.
Photo used here under Flickr Creative Commons.
Latest posts from David John Marotta
- #TBT A Review of Finances at Age 60 - July 25, 2024
- #TBT Implement the Automatic Millionaire at Schwab - July 18, 2024
- #TBT Stress Is Not Your Enemy - June 27, 2024