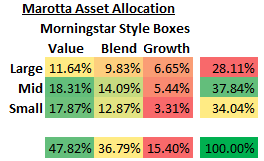
We’ve written a great deal about crafting an asset allocation along the efficient frontier of investing. In particular, we advocated what we called the Marotta allocation based on Eugene Fama’s presentation in 2010 of the U.S. market returns from 1927 through 2010. The Marotta asset allocation method uses the Sharp ratios to produce an asset allocation which over weights those categories with a better Sharp ratio.
Such an allocation underweights small growth in favor of large blend, mid-cap value and small cap value. Here is the resulting static asset allocation:

On top of that, for the past few years we have had a dynamic tilt (based on forward P/E ratios) toward large and growth. This moves some of the allocation from the small to large.
These techniques are a great strategy. For short periods of time it trends might move differently, but for the past three years this effect has been apparent.
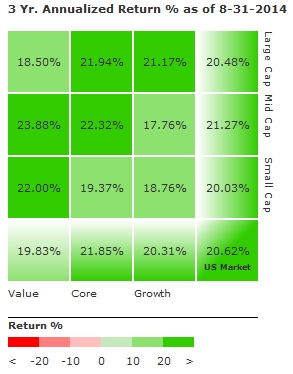
Here is the latest Morningstar data for the 3-year annualized returns based on style boxes:

First it is interesting to note the pattern (large blend + mid-cap value + small cap value) of where the best returns have been over the past 3 years.
This investment strategy would have been brilliant (based on long term historical returns) even if the past 3-years had not cooperated.
We make a distinction between a mistake (for example over weighting small cap growth) and something which is just unfortunate (for example I over weighted mid-cap value but it performed badly one year).
In this case what is a brilliant allocation was well rewarded by the markets over a time period even as short as 3-years.
Second, for those who don’t understand the stair step nature of the pattern, the pattern is easily missed when just looking at one axis.
For example, value had an average which was worse than core or growth. This is despite the fact that mid-cap value performed the best of any category and small cap value came in third.
And large, mid and small cap all performed very similar to each other while the stair step allocation showed a much greater difference.
Finally, this allocation (for just the US stock portion) can be created using just five very low cost exchange traded funds:
- 20% Vanguard S&P 500 ETF (VOO)
- 10% Vanguard S&P 500 Value Index ETF (VOOV)
- 30% Vanguard Mid-Cap Value ETF (VOE)
- 20% Vanguard Small-Cap Value ETF (VBR)
- 20% iShares Russell 2000 Value Index (IWN)
It is mostly coincidence that the percentages are all multiples of 10%.
This allocation for the style box part of the US stock portion of your portfolio has an extremely low expense ration of about 0.19%.
The allocation also allows an easy movement of the dynamic asset allocation movements between small value and large blend or growth. You can move 10% of IWN to VOO to move small to large. And you can move 10% of VOOV to VOO (or even VOOG) when you want to move value to growth. This dynamic tilt should boost returns even more over long periods of time.
These are long term investing strategies. The standard of deviation will make it seem as thought the choice is the flip of a coin, but over long periods this allocation should do well.