 Rebalancing is a topic often discussed without precision. This lack of accuracy causes great confusion among independent investors.
Charles Rotblut recently wrote and article entitled, “Rebalancing Update: The Market’s Volatility Eliminated the Need to Adjust Allocations” for the American Association of Independent Investors (AAII) Journal.
Rotblut’s article covers a great deal of analysis looking at several different portfolios and strategies over multiple multi-year periods. He also provided downloads of his spreadsheets so that his work could be checked and verified or so that others could use his work with different strategies. In this article, I will agree with many of his conclusions and suggest a different way of analyzing the benefits of rebalancing.
Panic and Sell
Among his strategies Rotblut includes the panic and sell reaction which “assumes an investor temporarily switches to an all-bond allocation for one year whenever the S&P 500 index incurs a calendar-year drop of greater than 20%.”
Starting with a portfolio of $100,000 in 1988, Rotblut shows how panicking results in a portfolio 30 years later which has $458,368 less than a portfolio which is rebalanced. As he concludes:
The Ongoing Penalty of Panicking
Our models have continuously shown a steep price for panicking. The models treat panicking as switching to an all-bond portfolio whenever the S&P 500 falls by more than 20% on a calendar-year basis and then waiting an entire year before getting back into stocks. We view this as a conservative assumption, as many investors wait even longer after exiting stocks over worries about what might happen.
As of the end of last year, an investor who stayed out of the stock market during 2003 (following a 22% drop in the S&P 500 in 2002) and during 2009 (following a 37% drop in 2008) would have ended 2018 with nearly $460,000 less wealth than an investor who stayed with a diversified portfolio and rebalanced periodically. Not only is this a huge number, it has largely grown in size since we first started modeling the panic scenario in 2014 (“The Danger of Getting Out of Stocks During Bear Markets,” AAII Journal, May 2014).
Rotblut concludes and we would agree, “The impact of bailing out of stocks at the end of 2008 continues to have a lasting impact, even for an investor who got back in right at the start of 2010.”
I was asked by a client if there was a market drop large enough that we would recommend getting out of the markets entirely, and I answered, “No.” It is equivalent to, “If there were a new car you were interested in purchasing is there a price so low that you would no longer be interested in purchasing it?” The short-term volatility of stock prices are only loosely related to the value of the underlying companies and are moved significantly even when less than 1% of stock shares are being sold.
A drop in the S&P 500 is like a flash sale discount on owning all of the major companies of United States.
What do you measure a non-rebalanced portfolio against?
Without rebalancing, a portfolio will tend to increase whatever components have the highest return. For a portfolio balanced between stocks and bonds, typical market movements will result in a drift toward a greater percentage in stocks and therefore will have a higher mean return than a portfolio which is regularly rebalanced. Rebalancing would sell that appreciated stock and buy more stable bonds.
In simple terms, if a 50%-bond, 50%-stock portfolio drifts to a 25% bond and 75% stock allocation, what portfolio allocation should you compare this non-rebalanced portfolio against? It will beat a 50/50 rebalanced portfolio, because it has more stocks, but it will lose to a 25/75 rebalanced portfolio.
Rotbult comments on this in the article saying, “The most pronounced impact occurred in the non-withdrawal non-rebalanced portfolio. This portfolio ended 2017 with an equity allocation of 88.7%, well above the starting allocation of 70% in 1988.”
But if an investor was willing to have a more aggressive portfolio with 88.7% in stocks, why did they not set that as their initial asset allocation target? A portfolio that was 88.7% stocks the whole time would have outperformed a portfolio that merely drifted there.
Since a regularly rebalanced portfolio always has the same asset allocation, should a non-rebalanced portfolio be measured against a rebalanced portfolio with the non-rebalanced portfolio’s starting allocation, ending allocation, or most aggressive allocation? In other words, if the investor would tolerate a 88.7% stock allocation, why not measure the non-rebalanced portfolio against a rebalanced portfolio with 88.7% stock and 12.3% bonds?
Not only did the stock allocation grow large in the non-rebalanced portfolio, but specifically the mid- and small-cap allocations grew the most as components of that stock portfolio. Meanwhile, the large-cap and foreign stock portions shrank as a percentage of the portfolio.
Rotbult rebalanced portfolios periodically whenever the weighting of any single fund was more than five percentage points above or below its target. Even this technique, based on a Vanguard study, allows the rebalanced portfolio to drift more aggressive than the allocation targets. Any allowance for more volatile components to grow to a 5% greater allocation will produce returns greater than one which is consistently rebalanced. But if you were willing for the portfolio to have a 5% greater allocation in categories with a higher mean return, you could have simply set that as the target allocation and then rebalanced regularly back to that allocation without waiting for tolerances to get out of balance.
These issues of analysis account for most of the articles which are found on the Internet critical of rebalancing.
In our article “Is Portfolio Rebalancing Overrated?” I suggested a methodology for measuring the rebalancing bonus between two different investments.
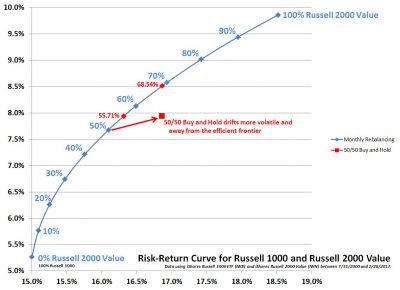
I suggested that for any non-rebalanced portfolio you could measure its mean return and volatility as measured by standard deviation. For the two different investments you could also plot a risk-return curve of all possible allocations of rebalanced portfolios between the two investments from 100% in the first and 0% in the second all the way through 0% in the first and 100% in the second. If the non-rebalanced portfolio falls within the risk-return curve, then there is a rebalancing bonus regardless of the starting and ending asset allocation.
However, for any risk-return point that is not on the efficient frontier, there exists a rebalanced portfolio that could have had a higher return, been less risky, or both.
It is possible in specific historical cases that there will be a zero or negative rebalancing bonus, but these are extremely rare. There may also be a case where the sequence of investing returns is critically important. But in most cases this will show an advantage to regular rebalancing.
In his article, Rotblut provided his analysis in the way of multiple spreadsheets. I downloaded the “25 Year Rebalancing 1993–2017” and looked at the Non-Rebalanced Portfolio tab which consisted of a starting asset allocation of:
- 20% Large Cap Stocks (VFINX)
- 30% Extended Market (VEXMX) which subsequently became 20% Mid Cap (VIMSX) and 10% Small Cap (NAESX)
- 20% International Value (VTRIX) which was moved into Total International Stocks (VGTSX)
- 30% Bonds (VBMFX)
In the Non-Rebalanced portfolio, these allocations grew out of balance over 25 years and ended at:
- 23.88% Large Cap Stocks (VFINX)
- 51.06% Extended Market (VEXMX) which consisted of 35.34% Mid Cap (VIMSX) and 15.72% Small Cap (NAESX)
- 11.84% International Value (VTRIX) which was moved into Total International Stocks (VGTSX)
- 13.21% Bonds (VBMFX)
In the Non-Rebalanced portfolio, a $100,000 initial investment grew to $825,086. This consisted of an 8.8% mean return with a standard deviation of 13.3%.
You could compare this portfolio either with a portfolio rebalanced annually back to the initial asset allocation, or a portfolio rebalanced back to the final asset allocation.
The Initial Allocation Portfolio rebalanced annually would have grown from $100,000 to $800,409. This would have been a 8.7% mean return with a standard deviation of 12.0%. This would have under-performed the Non-Rebalanced portfolio by $24,677. Letting the portfolio drift out of balance produced a 0.1% higher mean return.
The Final Allocation Portfolio rebalanced annually would have grown from $100,000 to $1,035,281. This would have been a 9.8% mean return with a standard deviation of 14.8%. This would have out-performed the Non-Rebalanced portfolio by $210,195. If you were willing to let your portfolio drift out of balance, you could have experienced a 1.0% higher return simply to set your asset allocation to the final allocation and then rebalance back to that portfolio regularly.
You could take a blend of these two portfolios and compare that against the Non-Rebalanced Portfolio. I tried analyzing a portfolio with an asset allocation that was halfway between the starting and ending Non-Rebalanced Portfolio and was annually rebalanced back to this asset allocation.
This Average Allocation Portfolio rebalanced annually would have grown from $100,000 to $912,919. This would have been a 9.2% mean return with a standard deviation of 13.4%. This would have out-performed the Non-Rebalanced portfolio by $87,833 with virtually no additional volatility.
This analysis shows that the rebalancing bonus in this simple portfolio might be as much as 0.4% annually.
This shows that the most pronounced loss of not rebalancing is not growing out of balance (that may even be a gain), but the lost investment opportunities. If you were willing to take more risk, you lose the returns you could have had if you had been willing to take those risks from the start.
Photo by Martin Sanchez on Unsplash
Latest posts from David John Marotta
- #TBT A Review of Finances at Age 60 - July 25, 2024
- #TBT Implement the Automatic Millionaire at Schwab - July 18, 2024
- #TBT Stress Is Not Your Enemy - June 27, 2024