 It is important to understand that attempts to beat the market through active stock picking have a poor track record. Stocks on average go up, and in Bull markets every stock picker thinks they are a genius. In general, any random individual stock is as good an investment as throwing a dart at random. Sometimes picking a stock can actually be worse than a dart because you’re following the masses and failing to think like a contrarian.
That being said, there are factors which can help determine the average expected return of a stock simply by what characteristics the stock has.
We have highlighted some of these factors already like size, value, and P/E ratio or quality, profitability, low volatility or even Freedom Investing.
Recently, we got this question from one of our readers:
I read Dan Lyons’ inside tell-all book “Disrupted: My Misadventure in the Start-Up Bubble” and thought it was hilarious. Now, I have a family member who works at Hub Spot and has stock options. What do you think?
Let’s use some of the publicly available information about HubSpot, Inc. (HUBS) to see what factors the stock shares.
Hub Spot is a publicly traded company that develops inbound marketing software for companies to manage and promote their online presence. The company started trading publicly in the summer of 2014.
All of the following information was taken from Yahoo! Finance, Schwab, and Morningstar after the close of the market on December 27, 2017.
Here is the stock growth for the past year:
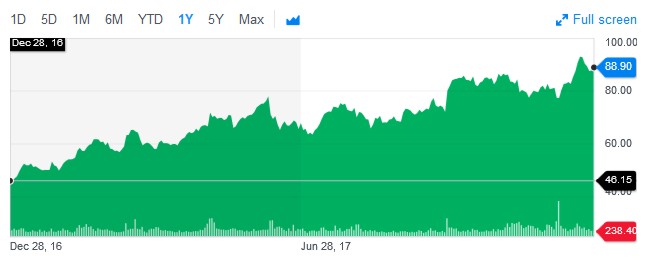
The growth of HUBS stock over the past 12- months from $46.15 per share to $88.90 is up 92.63%.
We have all heard that past performance is no guarantee of future results. More accurately, past performance has little if anything to do with future returns. The fact that HUBS is up 92.63% over the past 12-months has little if anything to do with its future returns. All of the publicly available information has already been factored into its current price.
That makes the below prediction of 4.02% additional growth from the “analyst” particularly suspect.
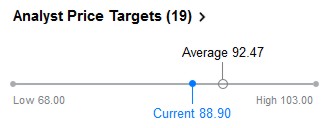
Here are some additional statistics about HUBS:
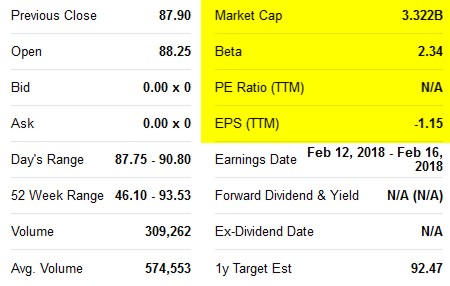
HUBS is a Mid-Cap Growth stock. A mid-cap company’s market capitalization lies between $2 and $10 billion. Market capitalization is calculated as how much it would cost to buy all of the outstanding shares at the current share price. Growth stocks are stocks whose price-to-earning (P/E) and price-to-book (P/B) ratios are high. Since HUBS has no earnings its price-to-earnings ratio is infinite.
One way of thinking about a stock’s value is to imagine a stock selling for $15 per share and earning $1 per share in earnings each year. If the company pays the earning to its share holders, in 15 years you will have been repaid the cost of purchasing the share and still own the share of stock which would continue to pay future earnings. That stock would have a price-to-earning (P/E) ratio of 15.
You might ask why anyone would pay $88.90 for a share of HUBS when it is losing $1.15 per share every year. It is because people think that the earnings will grow such that future earning will better justify the current value of the stock. That reasoning is why the share price of a growth stock can drop suddenly when it doesn’t grow as much as expected.
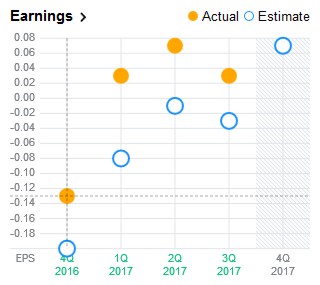
Although HUBS earnings over the past four quarters has been negative, the company has been doing better and has been exceeding analyst’s estimates.
Despite all this rosy outlook, mid-cap growth is a category that we recommend avoiding or under-weighting in a static asset allocation. The category has a lower return and a higher volatility than other style boxes. HUBS also appears to have a higher than average volatility in its statistics with a beta of 2.34. Beta is a measurement of how sensitive a stock is to market volatility. HUBS, on average, moves 2.34 times what the market moves.
HUBS is part of the technology sector. Generally, the technology sector in the United States is one of the best performing sectors.
HUBS is a tiny 0.03% component of the Vanguard Information Technology ETF (VGT), which is on our Buy List. VGT is up 38.80% over the past 12 months. Aggregating the 369 stocks that comprise VGT together in one ETF reduces the volatility compared with investing in a single stock such as HUBS.
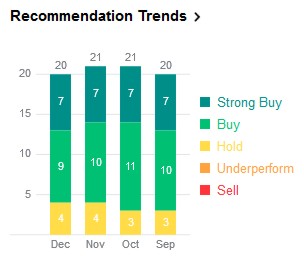
So do analysts recommend it or not? Among the 20 analysts listed on Yahoo! Finance not one of them thought that the stock would under perform the market:
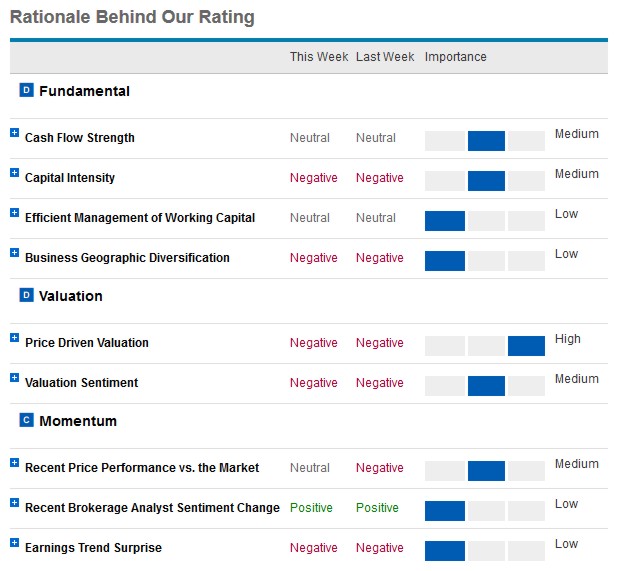
And just so you won’t let 20 nameless analysts talk you into buying a stock, Schwab grades the stock as a “D” and lists the stock as an under-performer. Here is their rationale for that rating:
Stock options are often offered at a discount. For example, employees may be allowed to purchase a certain number of shares at a discount from what the stock is trading. If employees can purchase the stock at a 5% discount, your family member could immediately purchase the maximum number of shares and sell them the next day for a 5% gain. Since the gain would be a short term capital gain, they would owe income tax on the appreciation. Alternately, if they held the stock for over a year the gain would be long term capital gains and they would owe tax at a lower rate.
We generally recommend holding the stock just over a year and then selling the stock for long term capital gains. But holding the stock for a year risks the stock going down in price.
Given the lack of earnings and the volatile nature of the stock, I would not recommend purchasing this individual stock or over weighting this stock in a portfolio unless the stock options are offered at a lower price.
Furthermore, owning employer stock is more risky than holding any other stock. If the company goes bust or becomes seriously impaired, you not only lose your job but your savings gets wiped out as well. You should limit your holdings of your employer’s stock to 10% of your total portfolio or less.
Photo by Eduard Militaru on Unsplash