 Using a Global Index
The news tends to report one of three indexes: The Dow, The S&P 500, or the NASDAQ. The Dow is a price-weighted index of just 30 stocks. The NASDAQ Composite index is comprised of 46.4% information technology stocks. All three of these indexes represent U.S. Large Cap Stock, half of one of the six asset classes.
You can invest in single exchange-traded funds and your investment will be allocated across all of the investable assets in the world. Any decision to differ from the cap-weighted global default is a choice even if that choice is on account of ignorance. If you are over weighting the United States, that is a choice. In fact if you are over or under weighting any category, that is a choice.
Many American investors’ stock portfolios are filled with over cost mutual funds whose components are nearly all large cap U.S. stocks. A portfolio so comprised may closely track the S&P 500 but measuring against a global index is still a fair benchmark. Even if you are not invested globally, not investing globally is a choice. And you can measure your U.S.-centric strategy against the default of a diversified global portfolio. In some decades it may be favorable and in some it may not.
Here are a few indexes which represent a globally diversified portfolio.
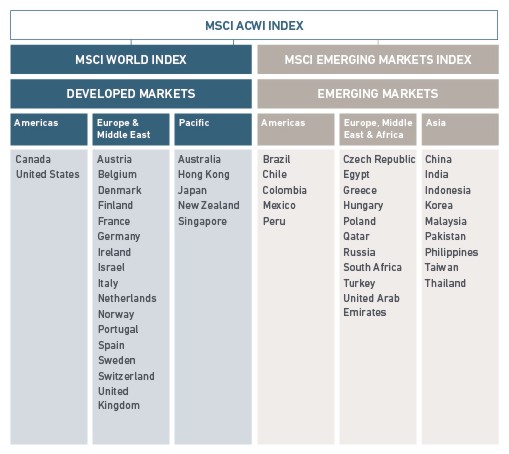
The MSCI ACWI Index
The MSCI ACWI Index includes about 2,781 stocks and covers 85% of the investable assets in the world. Although the index is 52.2% in the United States, it includes 23 developed and 24 emerging market countries.
The developed market countries are: Australia, Austria, Belgium, Canada, Denmark, Finland, France, Germany, Hong Kong, Ireland, Israel, Italy, Japan, Netherlands, New Zealand, Norway, Portugal, Singapore, Spain, Sweden, Switzerland, the U.K. and the U.S.
The emerging market countries are: Brazil, Chile, China, Colombia, Czech Republic, Egypt, Greece, Hungary, India, Indonesia, Korea, Malaysia, Mexico, Pakistan, Peru, Philippines, Poland, Russia, Qatar, South Africa, Taiwan, Thailand, Turkey and the United Arab Emirate.
The index began in 1988, which is one of the reasons it is not more commonly cited.
Although the value of the index is 70% large cap stocks, it also includes 15% mid-cap and 14% small cap. Simple math suggests that only about 36.5% of the value of this index is U.S. Large Cap. As a result, this index will not always move in sync with the S&P 500.
The historical correlation between the MSCI ACWI and the S&P 500 is about 0.86. That may sound high, but it is not. The average monthly difference between the return of the two indexes is 1.88%. For MSCI ACWI and the S&P 500, this means 18.4% of the monthly movements are not even in the same direction. This is an especially large difference when you consider that over half of the MSCI ACWI Index is comprised of stocks in the United States.
You can find the latest monthly fact sheet for The MSCI ACWI Index on the MSCI website.
You can track the MSCI ACWI Index directly on Morningstar and The Wall Street Journal.
iShares has an exchange-traded fund which tracks this index: iShares MSCI ACWI ETF (ACWI). You can track this ETF’s daily movements on Yahoo Finance, Bloomberg, and Morningstar to get a sense of how the global markets have moved.
The MSCI ACWI Index is the stock index which we use to benchmark stock returns when measuring client portfolio returns. This index started in 1988, integrates with most reporting software, and is accurate to five decimal places. For portfolios which are not 100% stock we blend this stock index with a short-term bond fund index.
The FTSE All-World Index
The FTSE All-World Index includes about 3,180 large and mid-cap stocks and covers 90 to 95% of the investable assets in the world.
The advantage of this index is that it tracks a greater percentage of the world’s assets. It also started in 1988, can be integrated accurately with most reporting software, and is accurate to two decimal places.
You can track the daily movements for The FTSE All-World Index on Yahoo Finance, and Financial Times website.
I don’t know of any ETFs which track this index.
The FTSE Global All Cap Index
The FTSE Global All Cap Index includes about 8,000 large, mid, and small cap stocks from about 47 developed and emerging market countries and covers about 98% of the investable assets in the world. This index began in just 2003 and is probably the most accurate index attempting to track every stock in the world. We don’t use this index yet because it doesn’t go back far enough to benchmark our portfolios. However, it is a great choice for a new investor.
You can track the daily movements for The FTSE All-World Index on the Financial Times website.
Vanguard’s Total World Stock ETF (VT) follows this index and has an expense ratio of 0.10%. You can track this ETF’s daily movements on Yahoo Finance, Bloomberg, and Morningstar to get a sense of how the global markets have moved.
Three Indexes Are Similar But Not Identical
For comparison between these three stock indexes, here are the returns of each index for the past few calendar years.
| Percent of the World | Index Name | 2017 | 2016 | 2015 | 2014 | 2013 | 2012 |
|---|---|---|---|---|---|---|---|
| 85% | MSCI ACWI Index | 24.6% | 8.5% | -1.8% | 4.7% | 23.4% | 16.8% |
| 93% | FTSE All-World Index | 24.6% | 8.6% | -1.7% | 4.8% | 23.3% | 17.1% |
| 98% | FTSE Global All Cap Index | 24.4% | 9.0% | -1.7% | 4.5% | 23.9% | 17.2% |
Even among these three globally diversified portfolios there is a variation of returns. These differences are a result of the differences in the percentage of the world’s investable assets. Those indexes which have a greater percentage of the world’s assets have more small cap stocks. When global small cap stocks out perform they will do better and when small cap stock under perform they will do worse.
Blending an Index Between Stocks and Bonds
If your portfolio has an allocation of 25% Bonds and 75% Stocks it will not move in sync with any all-stock index. We call your bond allocation “Stability” and your stock allocation “Appreciation” to remind investors why we have each category. We recommend having the next five to seven years of safe spending allocated to stability. We compare portfolio returns against a blended benchmark which represents the target mix of stability and appreciation. We represent Global Stocks by the MSCI All Country World Index (Gross Dividends) and bonds by the United States One-Month Treasury Bills.
We use this short-term bond index because while we recommend a smaller allocation to bonds than many other firms, we recommend that your bond allocation be relatively stable. Bond indexes include large allocations to low quality and long duration bonds. If your portfolio has a larger allocation to bonds and includes higher-yielding bonds it would be more appropriate to use a total bond index for your stability allocation. While these categories on average make more than short-term quality bonds, if you want to take more risk, we recommend investing in stocks instead.
Here is an example as of the end of June, 2018.
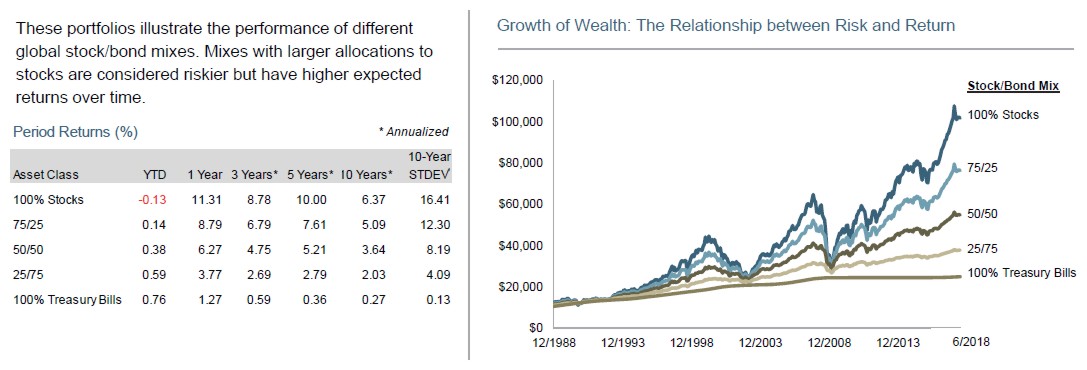
Given these two indexes you can create you own blended benchmark index appropriate for what percentage of your portfolio is invested in stability (bonds) and appreciation (stocks).
Photo by Patrick Tomasso on Unsplash
Latest posts from David John Marotta
- #TBT A Review of Finances at Age 60 - July 25, 2024
- #TBT Implement the Automatic Millionaire at Schwab - July 18, 2024
- #TBT Stress Is Not Your Enemy - June 27, 2024