For a while now when you first log on to Schwab Alliance, you are greeted with a large dark grey banner that lists your “Personal Value” followed by either a green or red number denoting a certain time period of change. We’ve been critical of Schwab’s Personal Value feature in both up markets and down ones.
Recently, Schwab issued a new update so that you can change the reporting at the top of your Schwab Alliance from “Personal Value” to “Investment Income.” They also added a feature that allows you to “Hide Chart” and compress the banner down to a much smaller size.
For the average investor, we recommend that you both “Hide Chart” and that you set the time period to as long as possible (currently 2 years).

There are a handful of clients who may benefit from using Schwab’s new “Investment Income” feature. To use this feature, first click on the drop down menu and change your selection from “Personal Value” to “Investment Income.”

The website will then reload into a page that looks something like this:
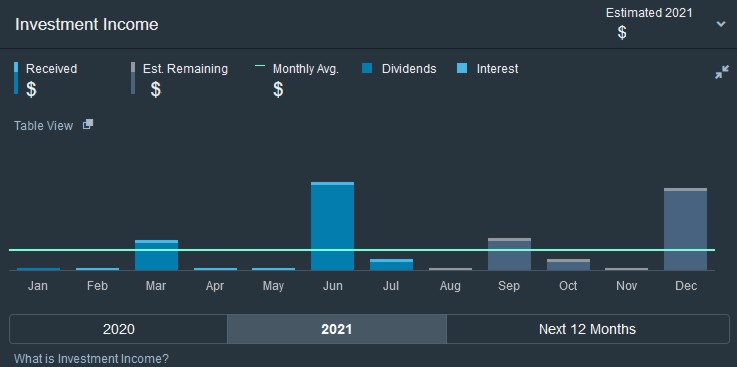
This graph shows your “investment income” defined as “money you’ve already received up to today” or “could potentially receive in the future based on dividends and interest from securities you own now” from only the Schwab accounts you have selected to be included in your Investment Income graph.
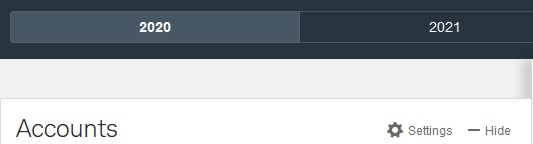
At the bottom, you have the option of viewing last year’s actual (2020), this year’s actual plus estimated (2021), or the next 12 months estimated (Next 12 Months).
At the top, it will summarize the total expected (Estimated 2021) or received (Received 2020). It will also let you know how much was from interest and how much was from dividends.
Before you review the graph, you should make sure you set up which account(s) you want included in the estimates. You do this by clicking on the “Settings” cog down below the graph in the white “Accounts” box.
Once you click on settings, the “Summary Settings” box will open and give you the options to group or nickname your accounts, if you haven’t done that yet, and also to decide which assets should be included in your Investment Income reports.
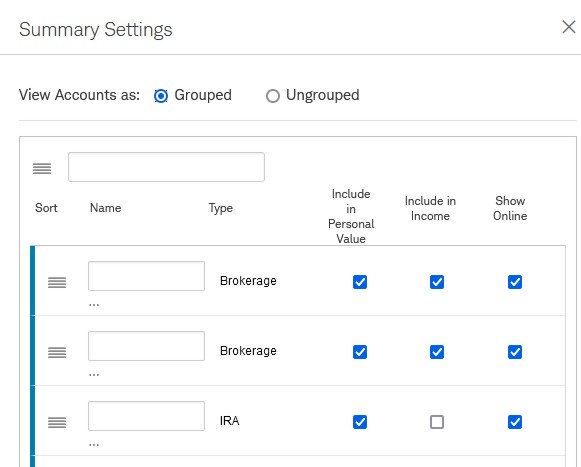
For each account, you will likely want “Show Online” to be checked. I’m not sure why they have the feature to hide an account and sometimes accounts are oddly hidden by default, so make sure those are all checked on.
The “Include in Income” option will determine whether the account is included in the Investment Income calculations. The blue check mark means that it is included in the calculations.
Which accounts you want included likely varies on why you are interested the report.
There are two main people I can imagine who may benefit from this report. Both are people who benefit from predicting their dividend yield before it happens.
Tax Predictions
First, someone who is trying to predict their future tax liability before tax documents are issued. For example, you may be trying to plan your estimated tax payments or estimate how much room you have for Roth conversions.
If you fit into this category, you will want to set up your Investment Income graph to only display taxable accounts. This would mean making sure that every “Brokerage” account is checked on while each other account type (like IRA) is turned off.
After you get this graph all set up, you may also benefit from reading “How to View Realized Capital Gains and Losses on Schwab.com” so you can get a fuller picture of taxable events in your brokerage accounts.
Trust Investment Income
Second, another person who benefits is trustees or trust beneficiaries who are trying to estimate what their trust income distributions will be in advance of the final calculations.
In this case, you would benefit from setting the Investment Income graph to only displaying the trust account. This, unfortunately, likely means unchecking every other account.
In either case, new accounts opened at Schwab are included in the graphs by default. This means that before you rely on its reporting for your estimates, you should take the time to confirm that only the accounts you want included are actually included.
Once your settings are configured as you want them, the included accounts will display with a white background in their rows of the Accounts table while those which are excluded will display with a gray background. Meanwhile, Accounts set to be hidden from online will not display in the table even if they are included in the Investment Income calculations.
Like many new features on Schwab’s website, they must be used responsibly to not create problems.
This chart reinforces the common myth that dividend paying stocks make better investments. Unfortunately, pursuing a strategy which maximizes dividends may result in minimizing appreciation, and, even though qualified dividends are taxed at the long-term capital gain rates, ordinary dividends are not qualified and are subject to ordinary income tax rates. This means a dividend yield strategy is likely less tax efficient than pursuing a strategy focused on capital appreciation.
While we hope this graph is helpful to the handful of clients who would enjoy having a copy of these numbers, for the average investor we recommend that you simply ignore these features.
If you run into any trouble or need more help interpreting the information you find, it is always best to call Schwab Alliance directly at 800-515-2157 or message them via the message center.
Latest posts from Megan Russell
- Four DPOA Limitations at Schwab and Their Solutions - July 23, 2024
- #TBT Implement the Automatic Millionaire at Schwab - July 18, 2024
- How to Implement a DPOA at Schwab - July 16, 2024