 All downturns in the market look similar when they start. They vary, however, in the slope, depth, and duration of the downturn. They also vary similarly in the recovery. There is no comparison with previous downturns that makes sense. There is no “Eerie comparisons to the crash of 2008
” as one story put it. Nor are there “spooky similarities” to any other market movement. Comparisons between one market movement and another market movement are simply both market movements moving roughly in the same direction for a time.
With confidence, historical stock market price comparison charts are meaningless. I have seen far too many financial authors using them.
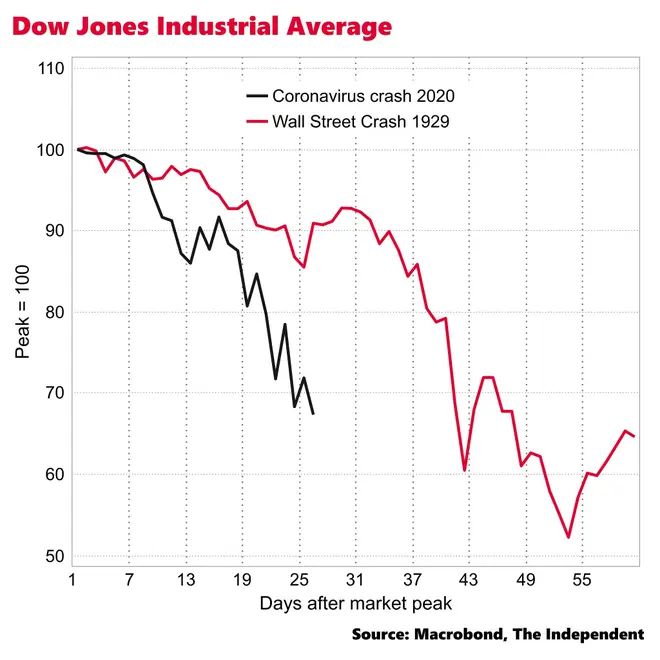
Here is a chart from a story published by Ben Chu, economics editor of the Independent on March 19, 2020, 4 days before the market bottom, entitled “US stock market falling faster than during the Wall Street Crash .”
This chart was intending to show that the Bear market in 2020 was worse than the 1929 crash. To quote the article:
How does this compare to the great share sell-off of 1929?
As the chart above shows, the Dow has actually been falling at faster rate over the past month.
The implication here is that the Dow will continue to fall just like 1929, but will it? In fact four days later was the relative bottom and the market started going up. Graph that on this chart and the chart just looks silly.
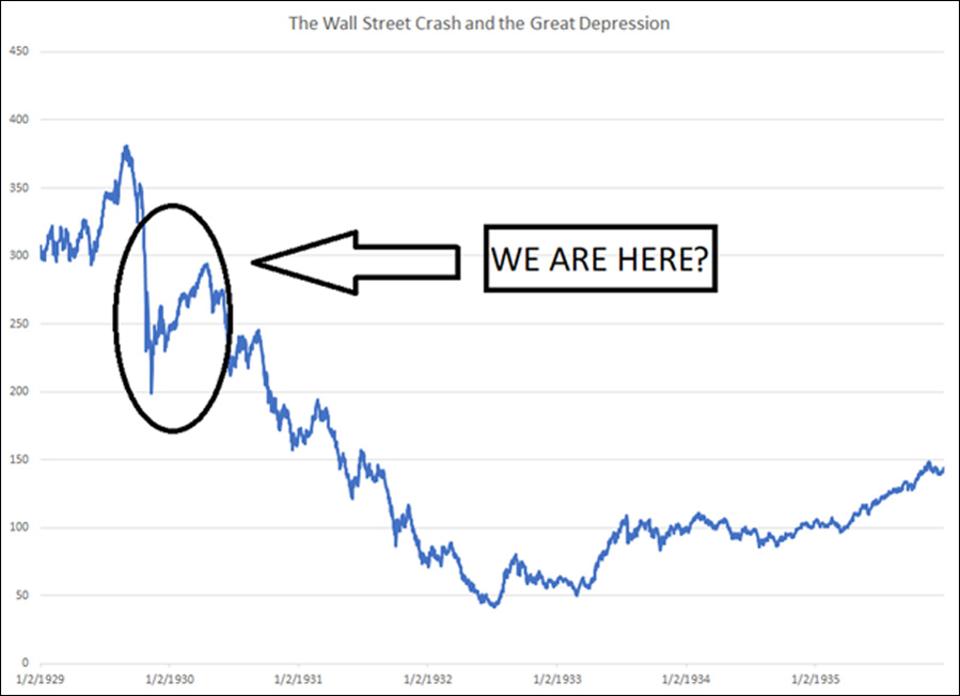
The story goes on to talk about the current Bear Market in terms of the 1929 crash. It shows this chart:
This chart is equally meaningless. What can we infer from this comparison? Nothing.
The downturn in 1929 was for different reasons in a different climate with a different economy. This graph is intended to shock us and make us scared that the market will fall that far again. Add in the latest return data and what little persuasive power the comparison had falls apart.
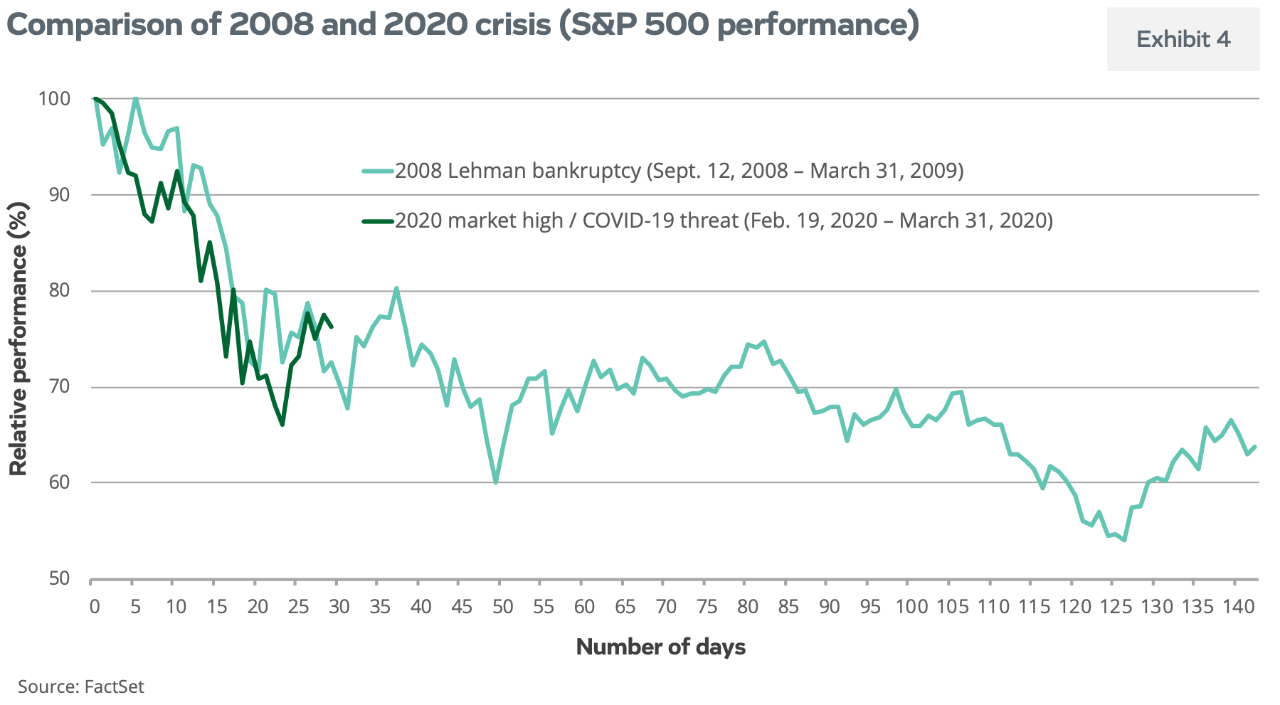
Here is a chart from “2nd Quarter 2020 Market Outlook: The Black Swan Has Landed, and the World Has Changed ” by Mark Simenstad, Chief Investment Strategist for Thrivent Funds:
See the up turn between day 20 and 25 on the 2020 line? This chart was made on April 2, 2020, meaning the market bottom of the COVID Bear Market was already 10 days behind us on March 23, 2020. Stretch the line out farther and the recovery makes this comparison again look foolish.
Regardless, the author says:
As the chart shows, although the current crisis has been relatively short, there are real similarities. Longer term the initiatives taken during the GFC, although controversial, were ultimately effective. The economy went on a historically long expansion, and investors in risk assets of all types enjoyed extremely attractive returns.
The term “there are real similarities” is simply misleading. There are always real similarities between two different market environments. It is the narrative fallacy which suggests that because there are similarities they must share other factors or causes. In reality, they are similar because there are only two directions the market can move — up or down — and if both lines move generally in the same direction for a time they seem similar.
It would not be hard though to section out two random time periods of the stock market and plot them together to imply something. With that kind of straight line thinking though, every boom or bust would be believed to continue as long as the last great boom or bust. However, this kind of thinking is simply foolish.
A Forbes article published on April 17, 2020 (25 days after the bottom) by Clem Chambers entitled “Stock Market Crash: Party Like It’s 1929 ” shows a similarly pessimistic view.
The author is careful to only predict (see the question mark) rather than state that the market will fall more, but he has still let the narrative fallacy get the better of him. He is confident that the markets will go lower, saying:
I believe we are here and I am now back into 100% cash, having bagged a nice 20% profit, by dicing with the crash. I am passing on the upside for now because however I twist myself up into a ball I cannot make sense of the bounce except to put it down to a market corner by the Federal Reserve or hopeless optimism by a generation of participants that can’t countenance a 1930’s style depression.
His recommendation, to be in 100% cash, has at least so far proven to be poor advice. Yes, the market may go lower, but the odds are always toward the upside. At any moment the markets can decide to move in either direction, and the market only does so because someone decides to buy or sell. We move the market as we buy and sell. Therefore, nothing is inevitable, but flatlining is almost always the wrong move.
Regardless of what happens next, these comparison charts are meaningless.
Photo by John Rodenn Castillo on Unsplash


