
The Sharpe Ratio uses in its formula the return of a so-called risk-free, guaranteed investment. But what is a so-called risk-free, guaranteed investment and how would you calculate its investment return?
It is worth acknowledging that there is no such thing as a risk-free investment. Everything has risks, even cash.
What is generally used as a proxy for the return of a risk-free, guaranteed investment is the current return of the 3-Month (90 or 91 day) Treasury Bill.
The return of the 3-Month Treasury Bill has been as high as 16.30% (in May, 1981) and as low as 0.01% (as recently as December, 2011).
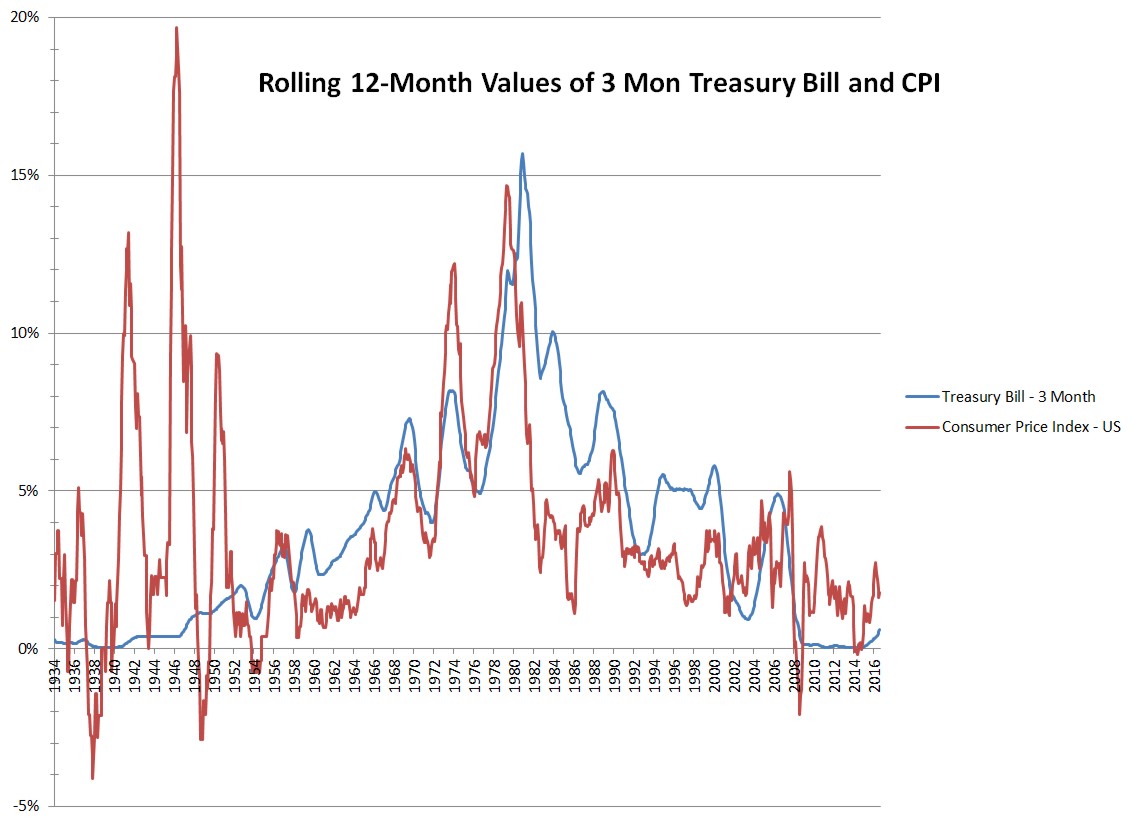
Here is a graph of the historical return of the 3-Month Treasury Bill from the Board of Governors of the Federal Reserve System (US), 3-Month Treasury Bill: Secondary Market Rate [TB3MS], retrieved from FRED, Federal Reserve Bank of St. Louis at https://fred.stlouisfed.org/series/TB3MS.
The reason why it is important to factor out the return of a risk-free, guaranteed investment before computing a sharp ratio is because otherwise the current rate of inflation would skew the Sharpe Ratio and make it even less useful than it is.
Imagine if you knew that an investment in January of 1982 was going to have a 22% return with a standard deviation of 15% while the 3-month treasury rate was 12.28%. In that case the Sharpe Ratio would be (22% – 12.28%) / 15% = 0.648.
This is considered the equivalent return-to-risk ratio as an investment expected to have a 10.72% expected return with a standard deviation of 15% while the 3-month treasury rate in only 1.00%. In that case the Sharp Ratio would be the same (10.72% – 1%) / 15% = 0.648.
In this case the the return of a risk-free, guaranteed investment helps to factor out inflation and produce a measure of the real return (return minus inflation) per unit of risk.
Observations
Here are some lessons which we can learn from the return of a so-called risk-free guaranteed investment such as the 3-Month Treasury Bill.
1. In the long run, the return of the 3-Month Treasury Bill has been a good proxy for factoring out inflation.
Since 1934 the 3-Month Treasury Bill has averaged 3.620% and the CPI index has averaged 3.626%.
2. The real return of a so-called risk-free guaranteed investment has been -0.006%.
Had you invested in the 3-Month Treasury Bill since 1934 your annualized real return would have been negative.
3. In the short run, the return of the 3-Month Treasury Bill has varied significantly from inflation.
While the rolling 12-month averages of the 3-Month Treasury Bill and Consumer Price Index (CPI) have been nearly identical, the short term variation has been significant. The 12-month rolling averages have differed by 2.44% on average.
4. Officially inflation has been low since the government changed the way it is calculated, but we should not count on low inflation.
I’ve written about how the government changed the method of calculating inflation in the mid-1990s, lowering the reported measures of inflation. After getting inflation under control in the early 1980s, inflation from 1986 through 1996 averaged 5.62%. From 1997 to present inflation has averaged 2.16%. Although official inflation measures are low, that doesn’t mean that inflation has been low. For some expenditures important to retirees even the official inflation numbers have been steep. Healthcare costs were rising even before government measures caused them to rise even faster. Education costs have risen so high that without grandparent’s help it is difficult for students to graduate debt free. Housing costs have also risen sharply , again as a result of government failed efforts to give everyone low cost housing.
Even if official inflation measures are low, it is safer to assume that inflation will average between 4.1% and 5.0%.
5. Finally and most importantly, the risk-free rate does not help you achieve your long term goals.
The risk free rate aims to minimize short term volatility. But in fact, it does not even minimize long term volatility. The financial industry has arbitrarily picked 1 year as the measure for volatility used to make decisions for investors with a 30-year time horizon. This doesn’t make any sense. Long term real returns favor holding stocks.
Latest posts from David John Marotta
- #TBT A Review of Finances at Age 60 - July 25, 2024
- #TBT Implement the Automatic Millionaire at Schwab - July 18, 2024
- #TBT Stress Is Not Your Enemy - June 27, 2024