 Our firm has become known for our method of computing maximum safe withdrawal rates in retirement. Projections can become complex based on pulling Social Security forward or integrating safe withdrawal rates with a fixed annuity or a pension which does not adjust for inflation. But aside from these adjustments to calculations, safe withdrawal rate is a simple percentage of after-tax assets which can be spent based on your age.
I spent about a year and a half reading all the literature about safe withdrawal rates from the original 4% rule to the most recent articles in the Journal of Financial Planning. Most of the literature analyzed setting a withdrawal rate at age 65, adjusting it upwards for inflation, and then looking at the risk of running out of money. As a practicing advisor, few of our clients came to us at exactly age 65 and none of them adjusted their spending clearly by inflation.
Our methodology had to be able to address spending and asset allocation at any age as well as tell an overspending client how many years before they depleted their portfolio.
We also vetted our final computation and technique using Monte Carlo analysis to come up with a methodology that we thought would withstand the test of time. We used the methodology for several years internally before we published our first article on the subject in June of 2008.
Safe withdrawal rates are one of the most important calculations in all of financial planning. Set your spending rate too high and you risk running out of money before you die. Set your spending rate too low and you risk not being able to fully enjoy your early retirement years. The literature all suggested that a withdrawal rate between 4.1% and 4.5% was sustainable for 30 years. We used that literature to confirm that our age 65 safe withdrawal rate of 4.36% was in the correct range.
But safe withdrawal rates are not set in isolation from the rest of your financial plan. The only way you can have a safe withdrawal rates is by making assumptions about investment returns, and investment returns are based partly on your asset allocation. We recognized this even in the original article we published. Along side the 4.36% safe withdrawal rate for age 65 is a recommendation keep 25% of your portfolio in fixed income. This recommendation also comes from our own research and is corroborated by the financial planning literature which suggests that age 65 a 75% stock and 25% bond portfolio has a better chance of supporting 30 years of withdrawals than a 60%/40% or a 50%/50% portfolio.
Our safe withdrawal rates are based on having what we believe to be optimum asset allocation targets.
Having 5 to 7 years of safe spending in bonds helps guard the portfolio against the risk of poor returns being early in the sequence. Poor returns early in the sequence jeopardizes withdrawals if those early withdrawals result in selling too much stock investments while they are down before you can recoup the losses. If you are trying to withdraw the maximum of 4.36%, you should have about 25% of your portfolio in fixed income. If you are not withdrawing the maximum, you can have less of your target allocation in bonds.
If retirees are fearful of the markets and want to “play it safe” and put more than 25% in bonds, they will also have to play it safe and withdraw less than 4.36% of their portfolio. Only a 75% allocation to stocks will produce enough growth to support a 4.36% withdrawal rate. Bonds can barely be counted on with keeping up with inflation and cash might very well be one of the riskiest investment as it is guaranteed to lose value to inflation every year.
There is a smaller safe withdrawal rate for each “pay it safe” conservative portfolio based on the asset allocation.
At age 65, the safe withdrawal rate for an all bond portfolio is just 2.78%. This is basically allowing you to spend 1/36th of the portfolio for the next 36 years until you finish your 100th year. If you had an after-tax portfolio of $1 million, an all-bond portfolio would only allow you to spend $27,800 while an optimum portfolio would allow you to spend $43,600 a year. “Paying it safe” would force you to have a lifestyle only 63.8% of what you might be able to have if you were not so fearful of stocks.
If investing too much in bonds requires a reduced lifestyle, keeping money in cash requires an even more conservative spending rate.
At age 65, the the safe withdrawal rate for an all cash portfolio is just 1.04%. And if inflation is significantly higher than the historical average, you still risk running out of money anyway. If you had an after tax portfolio of $1 million, an all cash portfolio would only allow you to spend $10,400. You would be forced to have a lifestyle only 23.8% of what you might be able to have if you were not so fearful.
J.P.Morgan produces a quarterly Guide to the Markets. The Guide illustrates a comprehensive array of market and economic histories, trends and statistics through clear charts and graphs. They offer the guide for advisors to share with their clients. Page 68 contains the following graphic:
Sources and disclaimers: BLS, FactSet, Standard & Poor’s, J.P. Morgan Asset Management. Cumulative returns are calculated using historical data. Stock returns are based on the S&P 500, bonds returns are based on the Bloomberg Barclays U.S. Aggregate Index and cash returns are based on 3-month U.S. Treasury bills. 1-year returns are 20-year average annualized return from 12/31/1997-12/31/2017 for each asset class. 5- and 20-year returns are cumulative over that time period based on the annualized return. Past performance is not indicative of future returns.
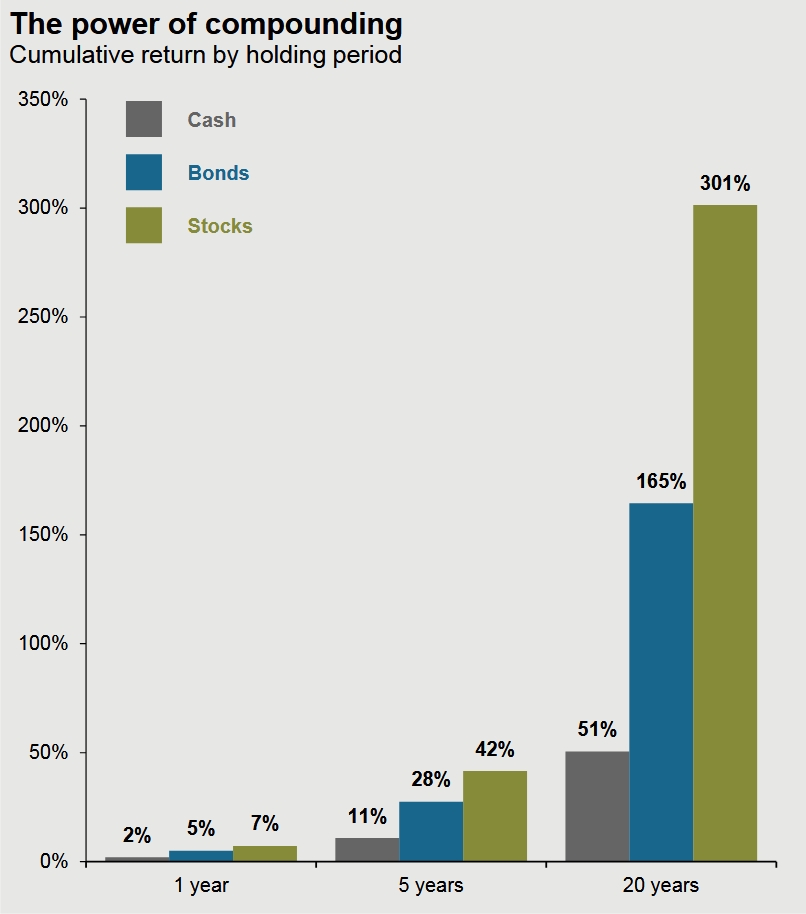
It could be argued that the time period in question, 1998 through 2017, has been above average in terms of volatility and market corrections. During that time period we experienced two significant market corrections in 2000 through 2003, and again in 2007 through the beginning of 2009. And yet when you look at the returns in retrospect, everyone should want to have been more invested in stocks and less in bonds and cash.
Invest even when you are afraid. Your asset allocation matters to maintaining a balance in retirement of having money for the next 5 to 7 years and keeping up with inflation for time periods of 8 years or longer.
Latest posts from David John Marotta
- #TBT A Review of Finances at Age 60 - July 25, 2024
- #TBT Implement the Automatic Millionaire at Schwab - July 18, 2024
- #TBT Stress Is Not Your Enemy - June 27, 2024