
We are usually not fans of FINRA, the Financial Industry Regulatory Authority, but they have an interesting tool on their website which shows the power of low cost investing.
The tool is a Fund Analyzer which can compare up to three different funds. We used the tool to analyze three different Canada stock funds:
- Fidelity® Canada Fund (FICDX)
- iShares MSCI Canada ETF (EWC)
- SPDR® MSCI Canada Quality Mix ETF (QCAN)
We have used all three funds in different contexts.
We recommended FICDX in our 2014 UVA Fidelity 403(b) Asset Allocation because it was the only specific free country available. Although, we simplified our asset allocation in our 2016 UVA Fidelity Asset Allocations and removed the fund from our security selection in favor of VTIAX which includes developed countries, emerging markets, and Canada..
EWC used to be our first choice Canada investment, but about a year ago we switched to QCAN in order to have a better quality mix, lower expense ratios, and no transaction fee.
Among other analysis, The FINRA Fund Analyzer shows a hypothetical difference in the fees paid between the three funds. It assumes that all three funds receive the same return and then computes the fees you would pay over several years. Here is the analysis for a $100,000 investment in each fund appreciating at 5.00% for a period of 10 and 20 years:
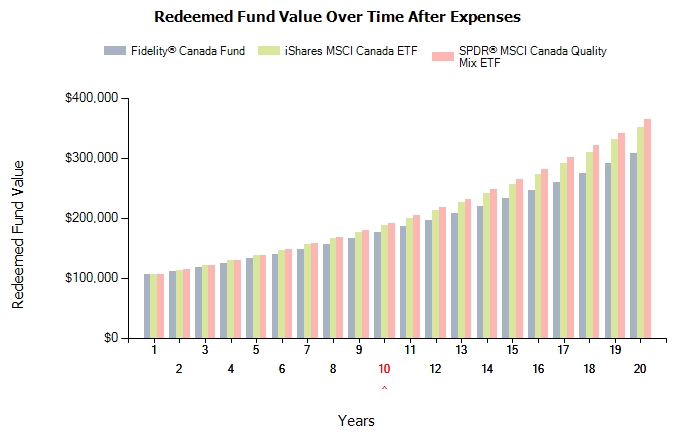
Based on this hypothetical scenario, here is the amount you would have paid in fees after a decade to each fund as well as the value of the fund to you after 10 and 20 years.
| Security | Expense Ratio | 10yrs of Fees Paid | 10yr Value | 10yr Difference | 20yr Value | 20yr Difference | |
|---|---|---|---|---|---|---|---|
| Fidelity® | FICDX | 1.15% | $15,429.28 | $175,346.76 | ($15,555.07) | $307,464.87 | ($56,970.22) |
| iShares | EWC | 0.48% | $6,681.40 | $187,496.62 | ($3,405.21) | $351,549.81 | ($12,885.28) |
| SPDR® | QCAN | 0.30% | $4,217.62 | $190,901.83 | $0.00 | $364,435.09 | $0.00 |
Wealth management seeks to find the small changes that over time have a great effect. In this case, a difference of 0.85% in expense ratio results in value difference of $56,970.22 after 20 years.
The work of continually curating a list of low cost funds is extremely valuable.
Photo in the public domain.
Latest posts from David John Marotta
- #TBT Are Democrats Or Republicans Better For The Stock Market? - October 17, 2024
- How To Distribute from A College America 529 Plan to a Designated Beneficiary - October 15, 2024
- #TBT Don’t Let Politics Make You Afraid of Investing - October 10, 2024