In this series we are looking at the Fama-French three-factor model of investment returns. Any model of investment returns tries to predict an investment’s returns and volatility by factors that can be measured in advance of investing.
The first factor, beta, taught us that the riskier, more volatile stocks on average have better returns. These same stocks, however, lose more value when the market is declining. We also learned there is no such thing as a safe investment that pays market rates of return.
The second factor of investing is size as measured by a stock’s total capitalization. A stock’s capitalization is found by multiplying the current share price times all the outstanding shares of stock. In other words, what would it cost to buy all the outstanding shares of stock at the current share price? This is called the total capitalization of a stock.
Today, large cap generally means stocks with a total capitalization of $10 billion. Mid-cap is between $2 billion and $10 billion. And small cap is less than $2 billion in total capitalization. Sometimes investors also categorize mega-cap stocks as those over $100 billion and micro-cap as those under $300 million. Those below $50 million have been called nano-cap.
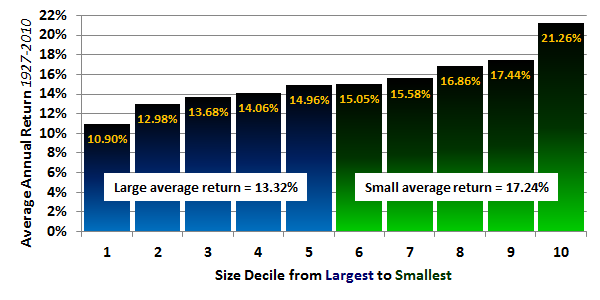
These absolute dollar amounts have gradually increased as the total U.S. market capitalization has grown. The analysis that Eugene Fama presented during our conference last fall analyzed returns of the U.S. markets from 1927 through 2010. He analyzed each decile from the largest 10% of the market through the smallest micro-cap. The results were remarkable.
The average return of the largest decile was 10.90%, and the smallest decile was 21.26%. There was a continuum such that each smaller decile showed a higher average return. The average return for the smallest half of the market was 17.24%, a full 3.92% higher than the larger half’s 13.32%.

Large-cap indexes include the S&P 500 (which is only approximately the 500 largest companies) and the Russell 1000 (which is only approximately the 1000 largest companies). The Dow is also a large-cap index, composed of just 30 large-cap stocks.
The only common small-cap index is the Russell 2000, which is approximately the 2000 stocks after the Russell 1000 largest companies. For the purposes of talking about index returns in this article, I am simply calling the Russell 1000 “large cap” and the Russell 2000 “small cap.”
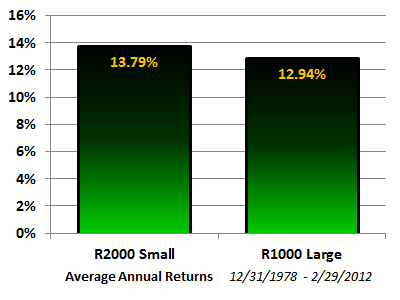
In my own analysis I measured the returns of the Russell 1000 large cap against the Russell 2000 small cap from 1979 through the end of February 2012. During that time period, small cap returned 13.79% versus large cap’s 12.94%, a premium of only 0.85%. This is partly due to the last half of the 1990s where large-cap stocks beat small-cap stocks.

But since the 1990s, small-cap stocks have again performed better. In fact, ending February 29, 2012, the Russell 2000 small-cap stocks have an annual return over the past 10 years of 7.00% versus only 4.63% for the Russell 1000 large-cap stocks.
There are many explanations why small firms tend to outperform large firms. First, their share price is more volatile. They have a higher standard deviation that often moves in sync with the markets producing a higher beta. Thus a portion of their excess return is explained by the first factor, beta.
Second, it is easier to double the revenue on a small startup company than it is to double the revenue on a large company. The outperformance of small-cap stocks depends on those few companies with exceptional growth. And the smaller the company, the greater the chance of doubling revenue growth.
Small companies are more likely to pay no or smaller dividends. Large cap is currently paying a 1.77% yield while small cap is only paying 1.27%. This is partly because smaller companies need to use the income to grow, whereas larger companies often have nothing better to do with earnings than return them to the shareholders.
The stock of smaller companies are more thinly traded. This means that a single investor can move the stock markets higher by buying and lower by selling. This is part of what makes small-cap stocks more volatile. Part of the excess return of small caps is dampened by the costs of getting in and out of the market moving the market.
When buying or selling small-cap individual stocks, it is important to put in limit orders so a purchase of a given number of shares does not move the market upward and you do not spend more than you had intended. Similarly, using a limit order when selling ensures that you get a fair value for the shares you are offering.
The conclusion from this study suggests that over time small cap will outperform large cap even after factoring out measurements of volatility. In future columns we will look at other factors of investing as well as indicators that suggest times to tilt even more small or back toward large cap. But for now, we can add size as another factor in expected equity returns.
E(Ri) = Rf + ßi(E(Rm) – Rf) + siSMBp
Where:
E(Ri) is the expected return on an investment
Rf is the risk-free rate of interest (about 3.67%)
For example, what you could get in short-term Treasuries
E(Rm) is the expected return of the market (about 11.71%)
E(Rm) – Rf) is sometimes called the market premium (about 8.04%)
ßi = Cov(Ri, Rm) / Var(Rm)
the sensitivity of the expected excess asset returns to the expected excess market returns.
Si is the size measurement of the investment
SMBp is the Small Minus Big premium (about 3.92%)
2 Responses
Willie Jefferson
What small cap mutual fund or ETF do you recommend for a small investor who have no fear of volatility?
Henry
Would have been interesting to see the standard deviations associated with the above deciles.