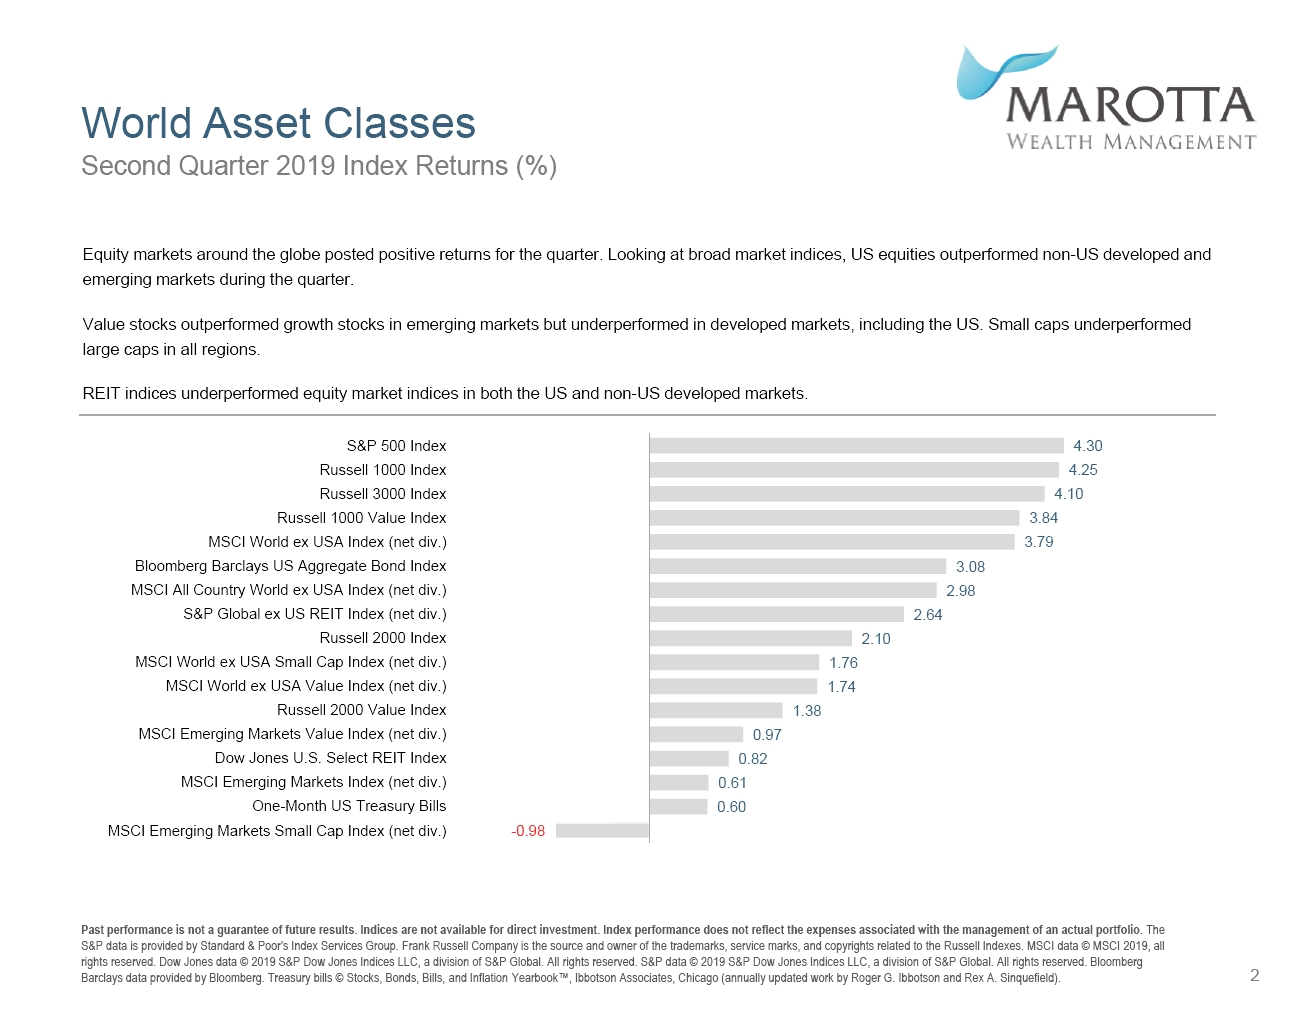
Among our quarterly client reports is a page that lists the index returns of several World Asset Classes. The slides are produced by Dimensional Funds, and for the Second Quarter 2019 that page looked like this:
Our intention in including this particular slide is to show the range of quarterly returns. It is meant to be descriptive, not prescriptive. Here is some wisdom on how to use this slide when comparing your own returns for the quarter.
The returns on this page are index returns. You cannot invest directly in an index. You can only invest in a fund, and that fund will have an expense ratio. Selecting low-cost funds is one of the best methods to simulate the index. Additionally, every fund drifts even from the index they are trying to approximate. Funds may, at times, have more or less holdings than the index. Or they may have holdings in different percentages than the index. Sometimes this variation produces a superior return. Other times it produces an inferior return. This random variation should be forgiven.
The returns on this page are mostly stock returns. Your portfolio is unlikely to be invested 100% in stocks. You may have a portion allocated to bonds. You are also likely to have some cash in your accounts. Only the returns of your stock components should be compared with stock returns. If your portfolio only targets 70% stock, then only 70% of the stock return contributes to the return of your portfolio as a whole.
You are likely invested in all of these indexes. The S&P 500, with its quarterly return of 4.30%, isn’t at the top because it is the value you should compare against. It is at the top because it had the best return. Investors tend to be dissatisfied with diversification when the return of the S&P 500 is above average. One of your investments is near the bottom of this list. Another near the top. Many are scattered about the middle. Diversification means that you will always have something to complain about.
Your stock return is likely to be in the middle of the pack. If you must compare your stock return to something, compare it to the middle value. There are 17 indexes listed on this page making the middle value, the Russell 2000 index. This median value is 2.10%. If you have a calculator, you could alternatively average all 17 numbers. The average return would be 2.23%. Or, as a quicker method, you could just average the highest and lowest values; this would result in 1.66%. Any of these are fast, reasonable benchmarks. It is not reasonable to compare your returns to the S&P 500 no matter where it falls on the list or to compare your returns to whatever did the best.
These indexes reflect the total return when reinvesting dividends. However, we recommend that you don’t choose to reinvest dividends. Price movements are separate from dividends paid. Both contribute to the return, but only the price movements may be reflected as unrealized gain on your statement. For example, the total return for the Vanguard S&P 500 ETF (VOO) was 4.27%, under-performing the index for the quarter by more than one quarter of its annual expense ratio of 0.03%. But if you held VOO in your portfolio, the price change would only show your holding up 3.70% during the quarter. The remaining 0.57% was likely paid in dividends or would have been the result of dividends being reinvested.
Your portfolio likely includes indexes not reflected in this list. We overweight the technology and healthcare sectors. Over time, we believe these allocations boost returns. For this quarter, technology did well, but healthcare did not. Vanguard Health Care Fund Admiral Shares (VGHAX) was down -0.96% for the quarter despite averaging 14.78% annually for the last decade. But even if the returns had been poor for the past decade, it is always an important time to stay invested.
A brilliant investment strategy should not be altered to chase short-term returns or react to short-term movements in the markets. Rebalancing is often the process of moving money out of what has just done well and into what has not. We believe this contrarian movement helps produce better returns over the long term.
Latest posts from David John Marotta
- #TBT How to Live on 24 Hours a Day - September 12, 2024
- #TBT How Much Umbrella Insurance Do I Need? - September 5, 2024
- #TBT How Does The Fed Control Interest Rates In A Free Market? - August 29, 2024