 Diversification dampens both the highs and the lows. You always have a dog to complain about and an investment that is your darling. In our U.S. strategy, Biotechnology and Consumer Staples often fill those roles, although they alternate which is which.
In our original 2020 analysis, we found that Biotechnology has shown an extremely low correlation to Consumer Staples, estimated at under 0.3. This low correlation means that the two sectors often perform very differently from one another, placing one as the dog and the other as the darling.
Over the course of 2021, the correlation between Biotechnology and Consumer Staples was the extremely low 0.2065. Biotechnology (XBI) was the dog with a 2021 return of -26.74% while Consumer Staples (VDC) was the darling with a 2021 return of 18.72%.
With returns like these, it is easy to wonder why Biotechnology is even part of the portfolio. Its low correlation means that it is the black sheep of the family, doing its own thing while the other sectors do something else together.
However, it is this low correlation specifically, the very thing that makes you dislike Biotechnology, which can give it a place in efficient portfolios.
We added both Biotechnology and Consumer Staples to our client portfolios in August 2020. From August 2020 through December 2022, Biotechnology (XBI) posted an annual return of -10.69% while Consumer Staples (VDC) posted +10.55%. Biotechnology’s returns were sporadic with periods of large gains, like +18.12% in November 2020, and periods of large losses, like -17.86% in April 2022. However, it was normally not doing the same thing as Consumer Staples. Their correlation was the amazingly low 0.1839 over this 17-month time period.
While an investment with a -10.69% return doesn’t sound like a great candidate for the efficient frontier, Biotechnology still earned a place in efficient portfolios over this time period, albeit a small one.
Using the market returns of SPDR® S&P Biotech ETF (XBI), Vanguard Small-Cap Value ETF (VBR), Vanguard Mid-Cap Value ETF (VOE), Vanguard Consumer Staples ETF (VDC), and Vanguard Health Care ETF (VHT) from August 2020 through December 2022, the three lowest risk portfolios on the efficient frontier all included a 10% allocation to XBI.
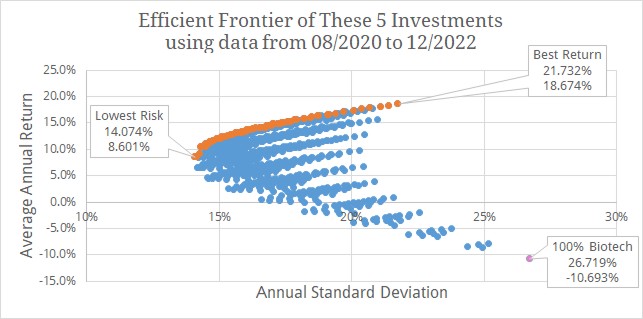
This graph shows a scatter plot of all possible portfolios created by blending these five assets in 10% allocations. The orange dots are the efficient frontier while the blue dots do not afford enough return given their risk to make it on the frontier. The pink dot is 100% Biotechnology. The labels show the portfolio risk followed by its return.

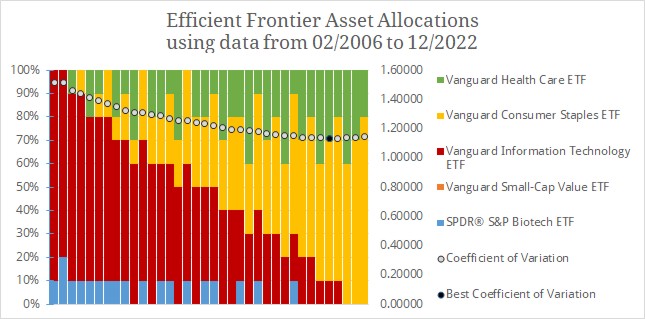
This chart shows the asset allocation blend of the 67 efficient portfolios from the other graph. The white dots show coefficient of variation, abbreviated COV. COV is risk divided by return. A smaller COV would be considered a more risk-adjusted return. The black dot is the smallest COV.
You can see that 100% Biotechnology with 26.719% standard deviation and -10.693% return is a far cry from efficient, and yet the three lowest risk portfolios all contain a 10% allocation to Biotechnology.
Over the time period, Small Cap Value (orange) earned the largest place in efficient portfolios with its superior return. However, Biotechnology (blue), despite having the worst return, dampened the risk of Consumer Staples enough to assist in creating the lowest risk portfolios for this short time period.
Over longer time periods, Biotechnology has had more exposure in efficient portfolios. Although its high risk means that smaller allocations are generally more efficient. Going from the inception of XBI in February 2006 until December 2022, here’s an efficient frontier from five of our buy list U.S. Stock ETFs:
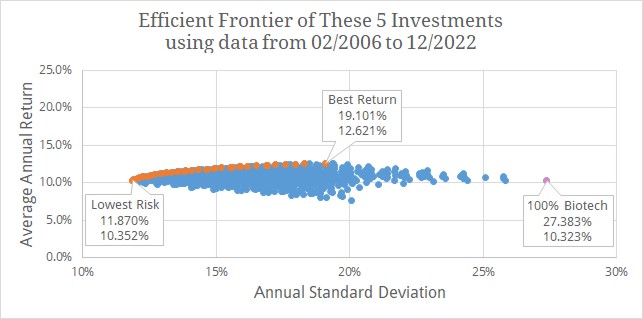
Over a longer time period, the portfolio returns are tighter and closer to the long-term average annual stock return. This time period has almost sixteen years rather than the previous graph which only had only 17 months.
Note that Vanguard Technology (VGT) is now the color red in this chart. The other ETFs have remained the same colors. Biotechnology can be seen in blue.
While 100% Biotechnology is too risky on its own to be an efficient portfolio, 17 of the 35 efficient portfolios feature at least a 10% allocation to Biotechnology over this time period. Efficient portfolios over this time period featured a blend of Biotechnology (blue) with Technology (red), because Technology had the highest return for the period. From February 2006 through December 2022, Biotechnology only had a 0.5520 correlation to Technology. It’s correlation to Consumer Staples was even lower at 0.3285.
Although an efficient frontier graph can feel like a guidebook where the science is telling you what you should consider investing in, there is more artistry to portfolio construction than made apparent by this simple tool. Efficient frontier graphs can only be created using historical data and past performance has little if anything to do with future returns.
A portfolio of 100% Small Cap Value or 90% Technology could have been an efficient portfolio over a specific time period but the same portfolio may not even be on the frontier over another time period.
Past performance is simultaneously all we have to predict the future and has little to do with what happens in the future. To be useful, efficient frontiers should be tested across multiple time periods with as much data as is available.
While an efficient frontier graph cannot hand you a perfect asset allocation, it remains a useful tool in analyzing what the past can tell us about a wide variety of investments. It is also a useful reminder that the individual returns of each security don’t tell the full story of a rebalanced portfolio.
Photo by Bench Accounting on Unsplash. Returns data gathered from Morningstar Advisor Workstation.
Latest posts from Megan Russell
- Four DPOA Limitations at Schwab and Their Solutions - July 23, 2024
- #TBT Implement the Automatic Millionaire at Schwab - July 18, 2024
- How to Implement a DPOA at Schwab - July 16, 2024