 We owe a great deal of our ideals of jurisprudence and individual liberties to the United Kingdom. In may ways, the United States has defined the ideals of freedom both by what we kept from the United Kingdom and what we rejected. Just as much can be learned from each country’s history and thought, investors would do well to have an asset allocation to both countries as well.
I analyzed the return and risk (as measured by standard deviation) of the S&P 500 Total Return Index and the MSCI UK Gross Total Return Index between 12/31/1969 and 4/30/2018, a period of just over 48 years. During that time period the S&P 500 had a total return of 10.45% verses the MSCI UK total return of 9.75%. The standard deviation for the S&P 500 was 15.06% verses the MSCI UK of 21.45%. Most foreign stocks have a higher standard deviation since the value of the US dollar fluctuates against foreign currencies and all of that fluctuation is counted against the foreign stock’s standard deviation.
Since the S&P 500’s mean annual return was 0.7% higher and the standard deviation 6.39% lower you would think that portfolios along the efficient frontier would not include any United Kingdom, but you would be mistaken.
The mathematics of the rebalancing bonus make it possible to receive a greater mean return and a lower standard deviation by mixing two investments than either of the two investments by themselves. The bonus is based on low correlation and high volatility. In this case, the correlation between the two sets of monthly returns was a positive 0.595, which is a rebalancing bonus of up to 0.11% over the S&P 500 and up to 0.81% over the MSCI UK alone.
I created asset allocations blending each of these components in 1% intervals from 100% in the S&P 500 all the way to 100% in the MSCI UK. These 101 blended portfolios were rebalanced monthly and the mean return and standard deviation measured for each asset allocation. Here is the risk-return analysis of each of the blended portfolios over the 48-year time horizon.
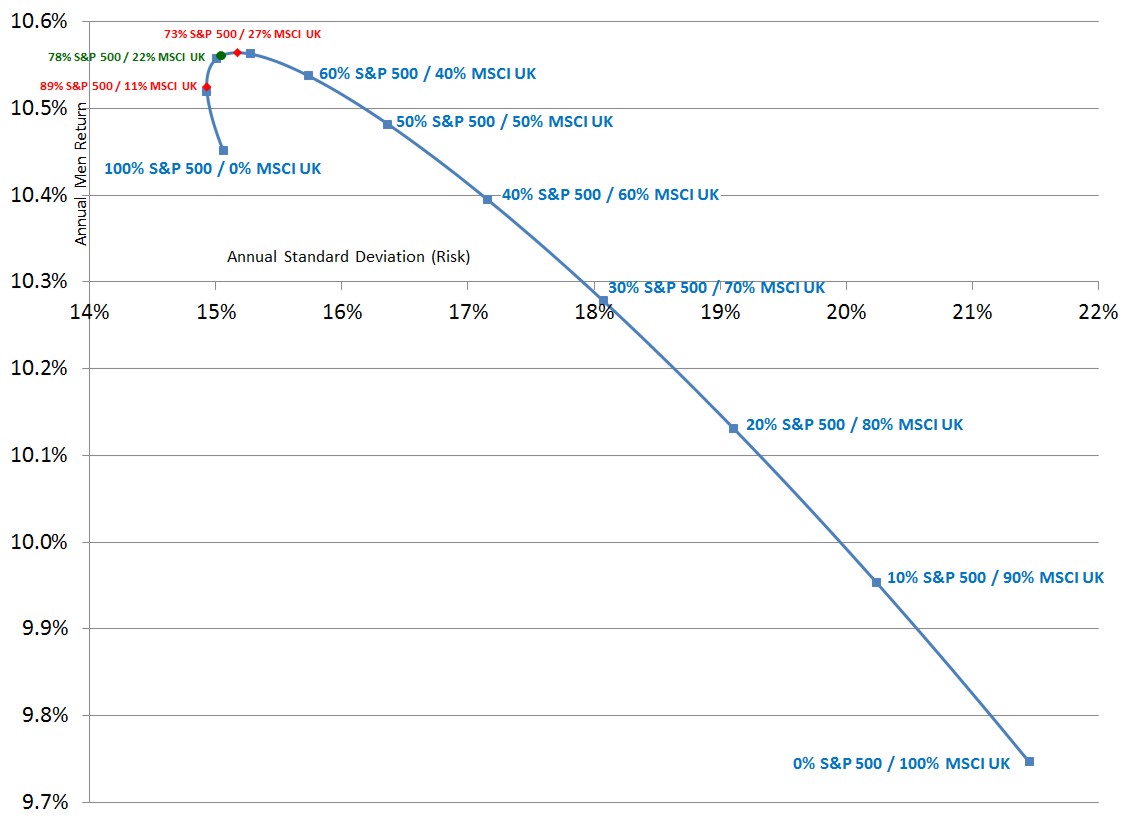
Portfolios along the risk-return curve have been marked with a square every 10% blend. This analysis suggests that, assuming that these long-term trends continue, investments in the United States will do better than investments in the United Kingdom. This may continue to be true, but until recently the United Kingdom did not have as much economic freedom as the United States. Here is the historical graph of economic freedom for the two countries.
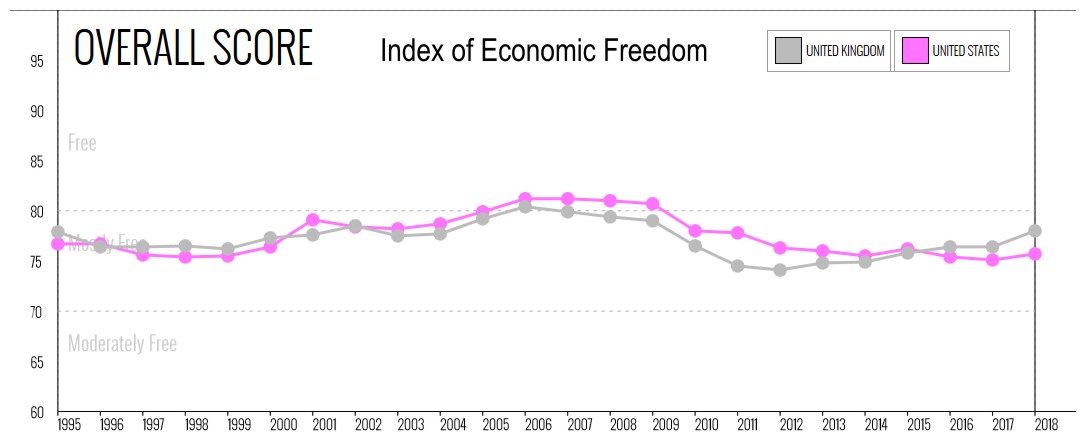
You can see that the United Kingdom recently passed the United States, as their economic freedom has turned upward while ours trended downward.
Assuming that these two are the only two components, the historical efficient frontier has been between an asset allocation of 89% S&P 500 / 11% MSCI UK (the lowest volatility) and 73% S&P 500 / 27% MSCI UK (the highest return). Neither an asset allocation of more than 89% S&P 500 nor one of more than 27% MSCI UK was on the efficient frontier. Both of these holdings are improved by adding the other to the allocation and rebalancing monthly. Here is a zoom of the blended portfolios on the efficient frontier:

Only the blended portfolios falling between the two red diamonds are on the efficient frontier. But notice that even a blind 50%-50% portfolio had a higher mean return than either country by itself.
Interestingly, if you look at 2018 Schwab Gone-Fishing Portfolio recommendation for age 40, the asset allocation between the United States and the United Kingdom fits nicely into this efficient frontier at the green circle.
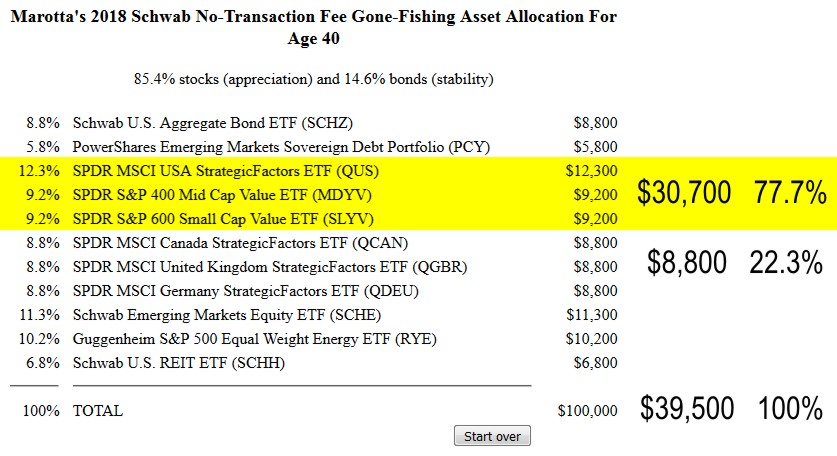
In this case I have grouped all the United States stocks together, including mid and small cap value, before determining the asset allocation between the United States and the United Kingdom. This is a good principle for forming the asset allocation within your asset allocation. If additional analysis found a benefit to adding a mid- or small-cap value United Kingdom fund I would split the 22.3% United Kingdom allocation into two components.
Investors who understand the math of the rebalancing bonus don’t worry as much about which investment will do better over the next decade. Instead they concern themselves with having a well-crafted asset allocation, implementing it with low fee funds, and rebalancing regularly.
Photo on Unsplash
Latest posts from David John Marotta
- #TBT A Review of Finances at Age 60 - July 25, 2024
- #TBT Implement the Automatic Millionaire at Schwab - July 18, 2024
- #TBT Stress Is Not Your Enemy - June 27, 2024