In my article entitled “The Optimum Asset Allocation to Gold Is Always Zero” I wrote:
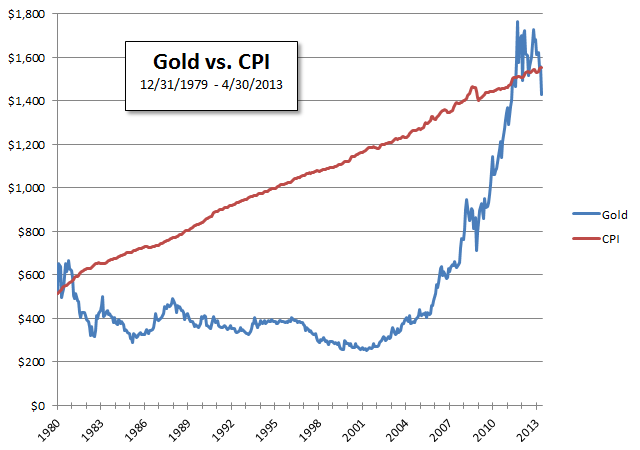
In 2013 gold is currently trading at $1,368.75. Adjusted for inflation, it has the same purchasing power as it did in 1979. For the past 34 years, gold has just kept up with the official figures for inflation, albeit gyrating wildly above and below the Consumer Price Index.
The price of gold closed 1979 at $512 an ounce. On 4/30/2013 gold was at $1,430.89. Since the end of April gold dropped to $1,368.75 where it was when I was writing the article.
Using the Consumer Price Index as the measure of inflation, $512 on 12/31/1979 would be $1,552.93 on 4/30/2013.
So $512 grew to $1,368.75 of gold or $1,552.93 of CPI Index equivalent purchasing power.
Here is a chart showing gold just keeping up (actually under performing) the official figures for inflation. It also shows the wild gyrations:

As I mentioned in the original article, “Gold and silver generally hold their value. They appreciate approximately by inflation. Little or no additional value is added. But gold and silver also rise and fall with global fears. They can be very volatile, even when measured in inflation-adjusted dollars.”
If you want to see the same time period including the S&P 500 Total Return read, “Since 1979 The S&P 500 Grew 13.5 Times Greater Than The Price Of Gold.”