
A gone fishing portfolio keeps investing simple. Last year in 2014 we recommended 13 investments. We made only minor changes in 2013, and minor changes again in 2014. Let’s look at how last year’s 2014 recommendation has done over the past year. We will use the asset allocation for $100,000 for a 40-year old:

Since the year has not ended, the analysis only goes through 11/31/2014. Each year we can either publish the next year’s gone-fishing portfolio early and not have a complete analysis of last year or we can wait for the analysis and then publish next year’s recommendation late. This year we are suggesting the change before the new year, so our analysis of last year is a month off.
As a result, when we use the phrase “during 2014” that means the 12 months between 11/30/2013 and 11/30/2014. It will include a month of 2013 and fall short one month of the end of the year.
During 2014, the Vanguard Information Technology ETF (VGT) had the best returns of 25.35%.
During 2014, the S&P 500 had the second best returns. The S&P 500 return was 19.73%. You can’t invest directly in an index. Consequently, Vanguard S&P 500 (VOO) did the second best in the portfolio returning 19.55% and has the lowest expense ratio of only 0.05%.
For index funds, the difference between the return of the fund and the return of the index is account for by the expenses of the fund and what is called “tracking error.” Since a fund isn’t an index, the fund has to try to mimic the index. When a stock enters the index the fund is supposed to buy it and when a stock leaves the index the fund is supposed to sell it. Sometimes the fund pays a heavy price for doing that quickly. And sometimes the fund pays a price for not doing it quickly enough. Additionally, with some indexes which include thousands of stocks, a fund might only purchase a sample of those stocks in an effort to track the index with fewer transactions and keep expenses low. Hence the term “tracking error.”
The expense ratio for the entire portfolio is only 0.32%. Morningstar did a study recently and found that low expense ratios are a better indicator of future return than Morningstar stars which rely on past return. Keep expense ratios as low as 0.32 with the Marotta Gone-Fishing Portfolio.
Last year we diversified some of the investment in Vanguard S&P 500 ETF (VOO) into the Vanguard Small Cap Value ETF (VBR). While VOO had a return of 19.5% the small cap value VBR returned 12.61%. Over long periods of time small cap value outperforms large cap blend, but that was not true this past year. Nevertheless we are keeping VBR in our 2015 Gone-Fishing Portfolio.
The 2013 portfolio had a 8.83% return. While US Stocks outperformed other categories in 2014, that wasn’t true for the first two quarters. Here is a graph showing how this portfolio underperformed or outperformed the S&P 500 for each quarter for the past decade. To be clear what this graph shows, it shows the difference between the return of the portfolio and the return of the S&P 500 Index. If the index was down 30% and the portfolio was only down 23% it will show on this graph as a positive 7% over performance.
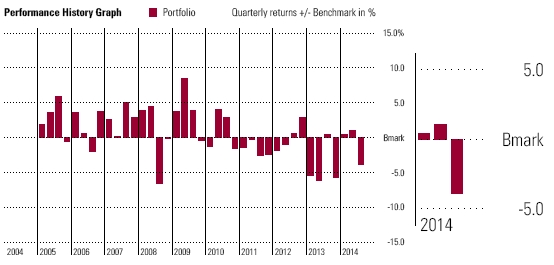
Since this portfolio has 14.6% bonds, we would normally expect it to under perform the S&P 500. But you can see in the expanded section for the first three quarters of 2014 that the portfolio outperformed the S&P 500 for the first half of the year, and then later in the year the S&P 500 did very well. Because the S&P 500 has been doing well the past three years investors are wired to suspect that it will continue to out perform other investments in 2015.
However, finding the highest performing asset class each year isn’t a good investment strategy. By creating broadly diversified portfolios which invest around the world, we are able to focus on the finish line of financial security rather than risk that security chasing the biggest returns. Every asset class will have a best day and a worst day, but diversification dampens that volatility allowing you to better stay on track to meet your financial goals. Over the past decade the return of this portfolio has averaged 9.87% (with 14.6% bonds) verses the S&P 500’s 8.06%.
We would not expect a portfolio of 14.6% bonds and cash (Stability) to normally out perform the S&P 500. But the portfolio has held up well over the past decade.

The US technology ETF was up 30.91%
The Country specific exchange traded fund (ETF) investments were up over the past year with the following actual returns: Canada (10.71%),Switzerland (6.32%), Hong Kong (5.08%), Singapore(3.38%), and Australia (-1.36%). The iShares Natural Resources ETF was up 9.63%, and the Vanguard REIT ETF was up 13.12%.
The US Bond mutual fund was up 3.29% and the foreign bond fund was up 6.15%.
I have explained the few changes I have made in the 2014 Gone Fishing Portfolio recommendation and you see the new 2014 gone Fishing Calculator.
Photo by Kerry J used here under Flickr Creative Commons.
Latest posts from David John Marotta
- #TBT A Review of Finances at Age 60 - July 25, 2024
- #TBT Implement the Automatic Millionaire at Schwab - July 18, 2024
- #TBT Stress Is Not Your Enemy - June 27, 2024