 A Bear Market is defined as an index dropping at least 20% from some previous high. There is no similar easy definition of a Bull Market.
You can always measure how far the markets have fallen from their all-time high. However, if you try to measure how far the markets have risen from their all-time low, it is impossible. The percent gain from the all-time low is nearly infinite. The markets have been appreciating for the past 200 years, albeit with some major corrections, Bear Markets, and even a crash or two.
Perhaps the best definition of a Bull Market is the time between Bear Markets. Using this definition, a Bull Market is between the last Bear Market low and the subsequent all-time high before the next Bear Market. In other words we are always in a Bull Market until a Bear Market interrupts and restarts the clock.
The Bull Market of the 1990s started on December 4, 1987 at the bottom of the previous Bear Market of 1987 called the Black Monday Bear.
At the time, investor sentiment was not positive. Popular authors warned about what they called the unavoidable recession, depression and crash of the financial markets during the coming decade. These books were best sellers and those who read them often “played it safe” and stayed out of the markets. The authors of these books predicted a deflationary depression and suggested that people remain in cash which would allow them to buy for pennies on the dollar after what they considered the inevitable coming drop.
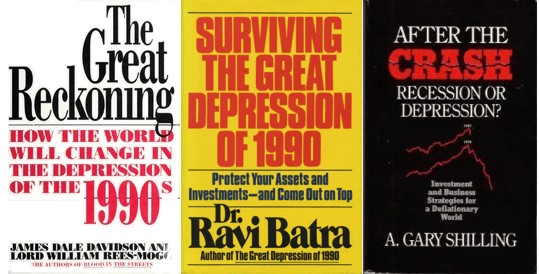
Usually doomsayers are safe when they predict some dire financial event during something as vague as a coming decade. Bear Markets and recessions are fairly common and ten years is a long time. And although what they call a disaster probably won’t be as dire as they predicted, ample excuses can be used to explain why the economy or the markets narrowly averted a more serious disaster. But the 1990s offered little chance for them to claim, “See, I told you so!”
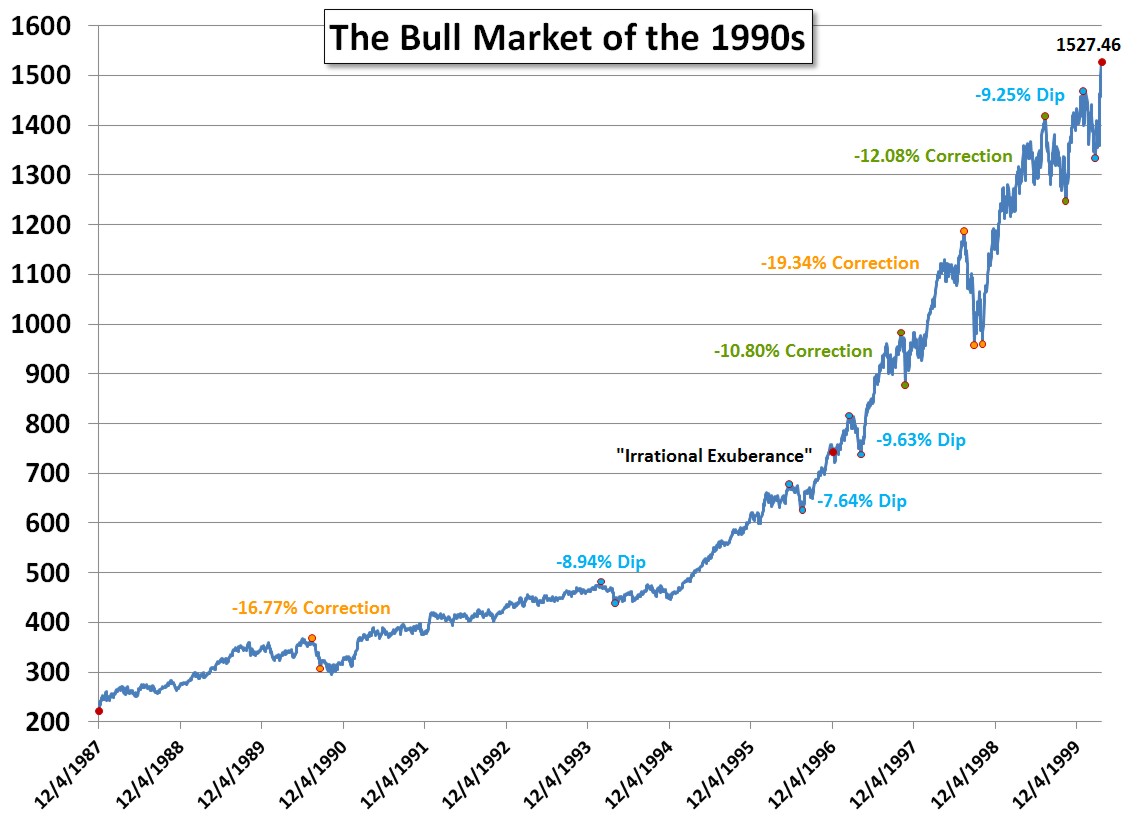 By July 26, 1989, the market, as measured by the S&P 500 Price Index, had fully recovered its prior peak and had begun setting new highs. During this 12-year time period, the market closed at 327 new all-time highs, which averages more than 26 per year.
As the market rose, it experienced at least four corrections, where the market dropped over 10% from some previous high. The largest correction dropped -19.34% just shy of a Bear Market. That particular drop bottomed just 83 days after the July 17, 1998 all time high. It was very short lived as just 43 days later the market was again making new highs.
In addition to four corrections, the market experienced numerous dips in value only to recover quickly again. On average, the market is down -10.24% from the all-time prior high. Because drops under 10% are so frequent, there is no official definition of a “dip” in the markets. On average, the stock market moves up or down about 3.41% every month and 5.77% every quarter.
These corrections, dips, and drops are so common that there is an entire investment strategy that advocates, “Buy on the dips.” But “Buy on the dips” is a good strategy only because of the first word: Buy.
On average, investing is always better than not investing. And investors who sit and wait for a dip in the markets before investing lose, on average, a full 1% of missed opportunity in the markets for every eight weeks they wait. Those who wait because there has just been a dip lose even more.
Investing works in the long run as the markets on average go up more than they go down. Patient investors are rewarded for their patient perseverance. But during the Bull Market of the 1990s, investors were rewarded for being invested almost no matter what they did. This gave rise to armies of day traders and investors who made money regardless of their strategy. Many came to believe either that they were brilliant or that investing was easy. They also came to believe that risk and volatility had disappeared, and that none of the classical wisdom regarding valuation mattered anymore.
During the 1990s, valuations as measured by the Price per Earnings or P/E ratio began to rise higher than their historical average, especially for technology stocks. The trailing P/E ratio of the S&P 500 gradually rose from 11.57 in November of 1988 to a high of 34.00 in April of 1999. This growing sign that the market was overvalued did not diminish the optimism that Internet and technology stocks were in their infancy and would ultimately remake the global economy.
In a speech on December 5, 1996, Alan Greenpan suggested that stock market prices had been pushed too high from the “irrational exuberance” of investors. At the time the trailing P/E ratio had risen to 19.19. Known for obfuscating his message so as not to spook the markets, this clear warning about stock prices was intended to purposefully dampen the enthusiasm:
Clearly, sustained low inflation implies less uncertainty about the future, and lower risk premiums imply higher prices of stocks and other earning assets. We can see that in the inverse relationship exhibited by price/earnings ratios and the rate of inflation in the past. But how do we know when irrational exuberance has unduly escalated asset values, which then become subject to unexpected and prolonged contractions as they have in Japan over the past decade?
Greenspan was pointing out that the markets were ignoring valuations, and investor excitement for the markets was pushing prices higher than earnings justified. He was warning investors that there might be a technology stock bubble which would eventually burst. Few heeded his warning.
The market dropped -3.08% over the next 7 trading days only to be setting new highs 17 trading days later. The P/E of the markets continued to climb.
Investors had decided that because internet stocks had so consistently appreciated without any regard to earnings that earnings must not matter any more. They began inventing other valuation methodologies to explain stock prices. One valuation measured people who spent more than 3 minutes on a website and called them “engaged shoppers.” Another Internet stock valuation metric was “price per eyeballs.” All of this wishful thinking was based on the idea that if you had a lot of people visiting your website you would be able to figure out how to monetize it at some vague point in the future.
Fortune Magazine published, “How Much Are Your Eyeballs Worth? Placing a value on a Website’s customers may be the best way to judge a Net stock. It’s not perfect, but on the Net, what is?” And The Journal of Accounting Research published, “The Eyeballs Have It: Searching for the Value in Internet Stocks.” These valuations metrics were ultimately discredited when the Internet Bubble burst.
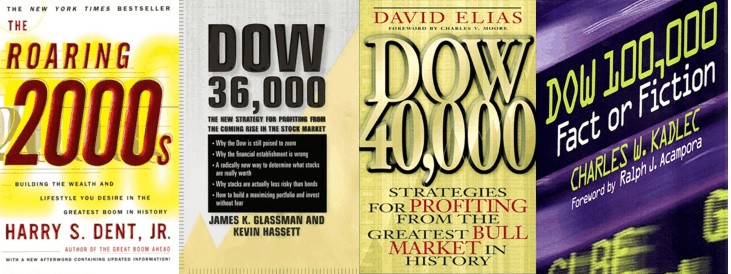
By the end of the 1990s books were being published predicting that the economy was positioned for the roaring 2000s. One of the more popular books, DOW 36,000 by Glassman and Hassett, suggested that stocks would soar to over three times their current value in a very short period of time. The dust jacket suggested:
Prices are too low because investors and Wall Street have been looking at stocks the wrong way: at valuation levels of the past (the traditional ceiling of the price/earnings ratio for example).
Within DOW 36,000, the authors argued that since stocks are no longer risky, prices will rise until stocks pay about the same as bonds. This equilibrium, they calculate, will result in the market having a P/E ratio of about 100. They suggested that this would happen in the next three to five years and push the Dow to 36,000. Not to be out done in optimism or book sales, other books suggested an imminent value of the Dow at 40,000 or even 100,000.
Neither the dire pessimism at the start of the Bull Market of the 1990s nor the blind optimism at the end were warranted. In both cases a cautious optimism would have suggested that investors should have a balanced portfolio of mostly stocks, but those stocks should have been diversified among many different categories and not all concentrated in large cap growth technology stocks.
The market as measured by the S&P 500 Price Index reached a new high of 1,527.46 on March 24, 2000. Just 22 days earlier, my father, George Marotta, gave a speech entitled, “Dow 36,000 or 6,000?” in which he warned that the stock market, and especially technology stocks, might be in a bubble. He wrote at the time:
The bad news is that we could be in a stock market bubble …
The eight largest NASDAQ capitalization stocks are trading at a price-earnings ratio of 50 which is 251 percent higher than average. …
There are those who say that the old measurements do not apply, that we are in a “new” economy, and that things are different this time. …
On the other hand, the market is very “pricey” when old-fashioned measures of stock market valuation are examined. There are other disturbing signs that may point to a “top” in this market. …
The Dow average now stands at about the 10,000 level. If the stock market corrects, what level of support should we expect. Well, if the Dow were trading at valuations that prevailed from 1926 through 1994, it would now be at about the 6,000 level.
When the Dow finally bottomed it was at 7,286.27.
George Marotta’s insight was not precognition. It was simply an observation of human nature: When people chase returns and buy what appears to be “going up,” it creates a bubble that is unsustainable. His advice was not a doomsday message that investors should get out of the markets to avoid a coming crash. It was a recommendation to have a balanced portfolio that includes many different asset classes including small and mid cap stocks and international stocks from a vast global market.
Such diversification may have gained less during the bubble, but it would also have lost less during the subsequent Bear Market. Overall we think this is a better approach than failing to invest on account of dire pessimism and then chasing returns based on blind optimism.
As we often say: It is always a good time to have a balanced portfolio.
Latest posts from David John Marotta
- #TBT Learning to Live on Your Own - April 18, 2024
- #TBT Frequency Matters More Than Height - April 11, 2024
- Implement a Savings Waterfall for 2024 - April 9, 2024