
State and local regulations are often even more burdensome than federal regulations.
This past year, the Pacific Research Institute tried to objectively measure the amount of small business regulation in each of the 50 states in order to rank them from most burdensome to least burdensome. As described in the Executive Summary, “The purpose of the 50-State Small Business Regulation Index is to create a benchmark that facilitates the comparison of regulatory burdens across the states, and provide insights regarding how each state can enact pro-growth regulatory reforms.”
Here is a description of the measurements they use to rank each state:
State regulations were categorized into two broad areas: labor regulations and regulations that impact other business costs. Regulations are categorized as a labor regulation if they: increase the cost of hiring a worker; increase the cost of employing a worker; create other obstacles to hiring a worker; and/or make it more difficult for a potential worker to obtain employment. State labor regulations examined in the Index include:
- Workers Compensation Insurance
- Unemployment Insurance Programs
- Short-term Disability Insurance Requirements
- Minimum Wage Regulations
- Family Leave Regulations
- Right-to-Work State
- Occupational Licensing Rules
Regulations are categorized as impacting other business costs if they increase the costs of land (and therefore businesses’ rents), increase non-labor operating costs, reduce profit-making options, or make it more difficult to start a business. Business regulations examined in the Index include:
- Land Use Regulations
- State Energy Regulations
- Tort Liability Environment
- Whether a State Implements Regulatory Flexibility
- Telecommunication Regulations
- Start-up & Filing Costs
- Whether the State Is a Control State (only state stores/state sanctioned stores can sell certain alcohol products)
While these are indicative of some of the burdens placed on small business, there are a host of others that are enabled at the state level but implemented at the local level. As a result, I think the correlation between small business growth and regulation is less than clear than if the Index had taken into account local-implemented state regulation and tax rates. Still, they did find correlation.
They divided states into thirds based on their rank.
They found that the average net change in small business establishments between 2002 and 2011 was 4.82% for the least burdened states, 3.14% for the middle, and 0.38% for the greatest burdened states. The median (instead of average) change was 3.61%, 2.72% and -0.66% respectively.
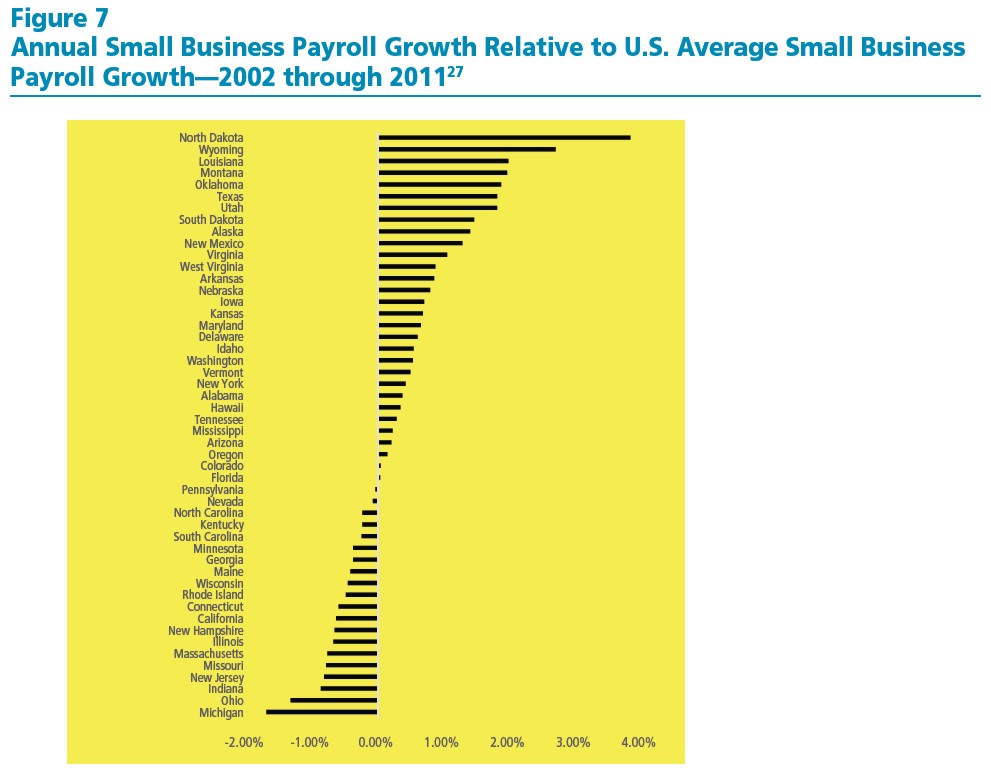
I was intrigued by Figure 7 of the study showing Annual Small Business Payroll Growth Relative to U.S. Average Small Business Payroll Growth—2002 through 2011.
I reproduced the data both to fact check it and also to see what a similar correlation was for the top, middle and bottom third of state.
Similar differences between the freest and least free states were measurable in the annual small business payroll growth. The average annual payroll growth between 2002 and 2011 was 2.24%. (Since government data collection runs years behind actual events, this is the latest data.)
Measuring each state against this average, states with less regulatory burden experienced greater than average growth and states with less regulatory burden experienced smaller than average growth.
Here is the data along with a trendline:
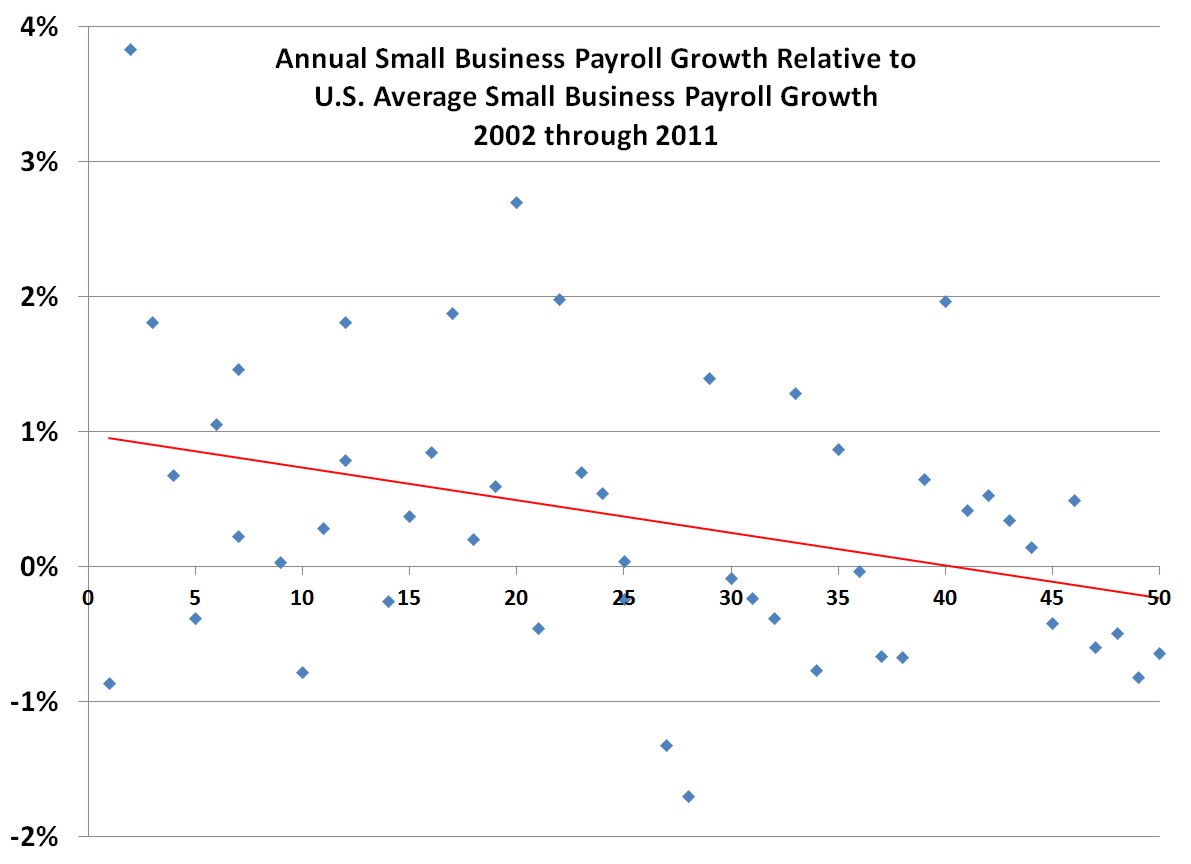
The difference between the average annual growth for the best and worst third of states was 0.69%. Given that the average annual growth of small business payroll in the United States over this time period was 2.24%, that makes the 0.69% difference a 30% difference in the total annual growth.
Thus, states with the least regulation have 30% more small business payroll growth than those with the most.
That is a tremendous advantage for businesses in states with less regulatory burden.
Photo used here under Flickr Creative Commons.
Latest posts from David John Marotta
- #TBT Learning to Live on Your Own - April 18, 2024
- #TBT Frequency Matters More Than Height - April 11, 2024
- Implement a Savings Waterfall for 2024 - April 9, 2024