With regular frequency, I receive warnings predicting dire market corrections. They all suggest that some market metric suggests that a correction is all but inevitable. Most of these metrics are not useful. The warning is usually accompanied by an offer to avoid this apocalypse by purchasing an investment, an investment newsletter, or sometimes it is just a survivalist plan which includes gold bullion or freeze dried food.
We do use a metric to measure market or index valuations: forward price per earnings as compared to their historical averages.
Price per earnings (P/E) comes in many different measurements each based on a different measurement of earnings (E). There is the trailing twelve months of earnings (ttm P/E), the cyclically-adjusted price-to-earnings (CAPE), and the future expected twelve month earnings (forward P/E). Forward P/E is based on an industry consensus of expected earnings. Each measurement has its difficulties, but either CAPE or forward P/E is better than ttm P/E at predicting future appreciation.
Historically when the markets have a low price per expected future earnings, they have a slightly higher expected appreciation. Similarly when the price of the markets is expensive compared to future expected earnings, they have a slightly lower expected appreciation. In simple terms, when you buy a stock, you are buying an expected stream of revenue. It is better when you can buy that expected revenue stream for less cost.
Although a favorable forward P/E suggests higher expected appreciation, using this metric does not justify jumping in and out of the markets. Even when the markets are pricey it is still better, on average, to be invested than not to be invested.
We use this metric to adjust the target sector allocation to about two dozen strategic underlying categories. We overweight those categories where earnings appear historically cheap and underweight those categories where earnings appear historically expensive.
At the end of 2017, the forward P/E ratio for the S&P 500 had crept up over half a standard deviation above average. Although not extremely high, it did mean that other categories and indexes were more favorably valued than U.S. large cap stocks.
J.P. Morgan offers a quarterly Guide to the Markets which always contains an updated S&P 500 Index Forward P/E Ratio. Here are two of the 71 slides from their presentation: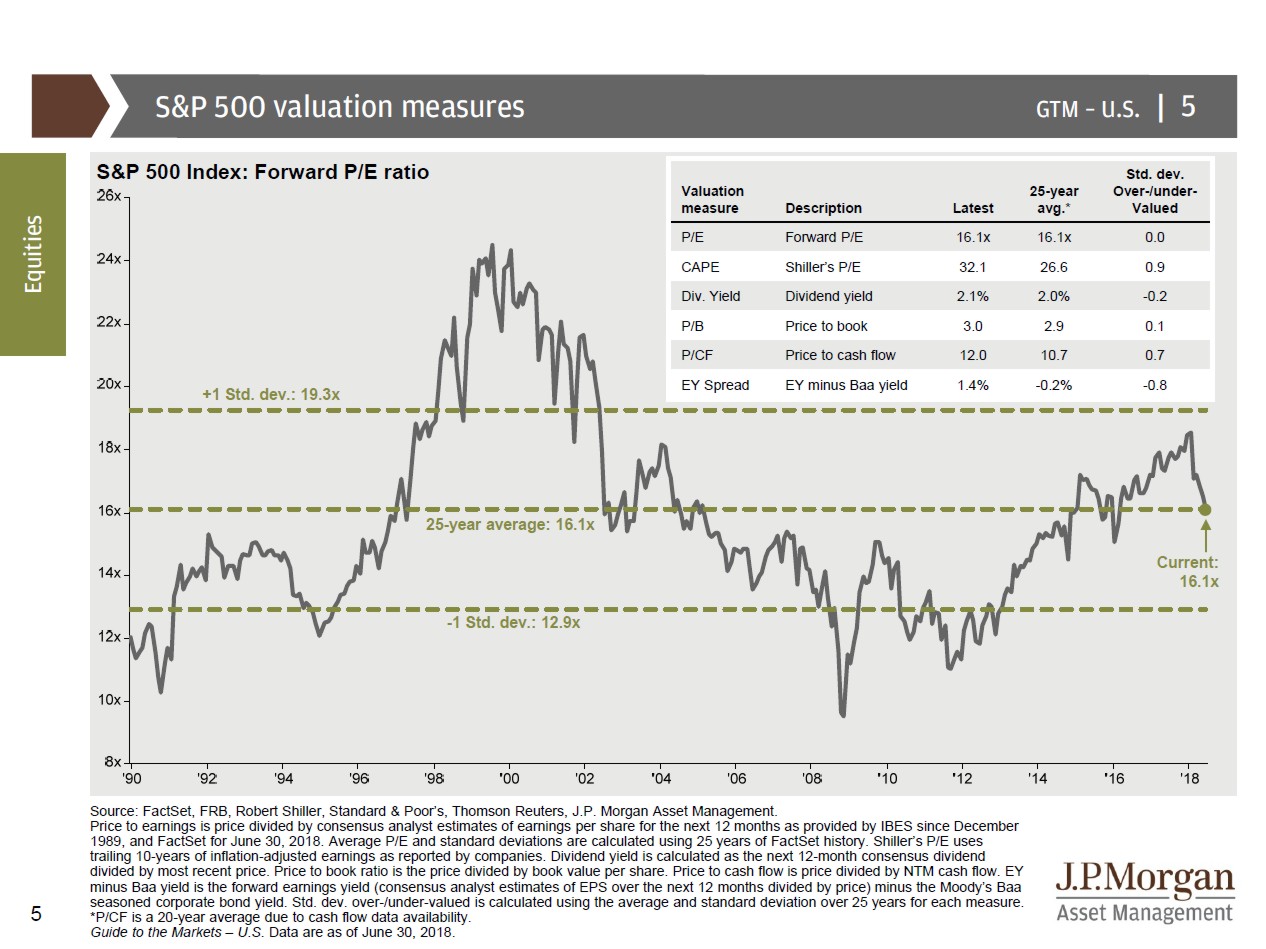
You can see from this graph that the forward P/E ratio of the S&P 500 as of June 30, 2018 is exactly valued at the 25-year average. This means that the price of the sector seems to be just about right given the expected earnings of the sector.
The change that pulled the forward P/E ratio to the historical average is the expected future earnings of companies in the United States. Without getting too political, the reduction in tax rates directly boosts corporate earnings. And that increase in expected earnings has resulted in a lower forward P/E ratio.
Here is a chart which shows the percentage of and the source of the growth in the S&P 500’s earnings per share: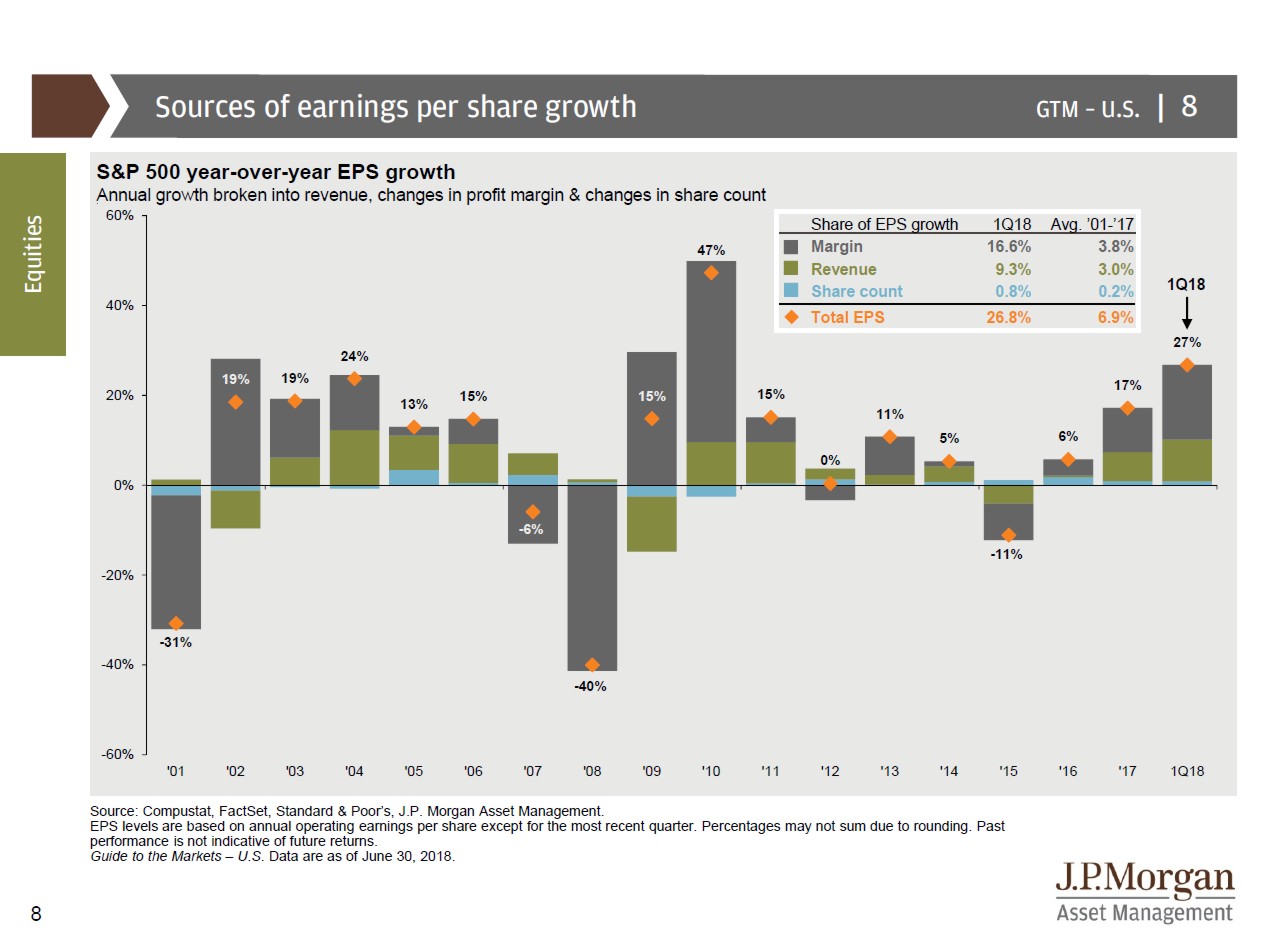
You can see that the S&P 500’s growth in earnings for 2018 is 27% and that most of the growth is attributed to “margin,” meaning it is not a change in revenue or share count. This “margin” category is likely to be an institutional change, like a change in tax rates.
These charts suggest that warnings that the United States markets are overvalued are simply not true. U.S. Large Cap is currently valued at the historical average again after taking into account the expected increase in corporate earnings.
Having said that U.S. Large Cap is fairly valued, U.S. Technology is slightly overvalued while U.S. Small-Cap Value is slightly undervalued and U.S. Mid-Cap Value has an even better valuation. We use these valuations to tilt slightly toward those categories which are undervalued and away from those which are overvalued in a dynamic tilt we use to boost returns.
Latest posts from David John Marotta
- #TBT Learning to Live on Your Own - April 18, 2024
- #TBT Frequency Matters More Than Height - April 11, 2024
- Implement a Savings Waterfall for 2024 - April 9, 2024