In 2017, stock market volatility was the lowest ever seen in the S&P 500 with an average daily movement of just 0.30%. Last year was also the only year that the S&P 500 had positive returns all twelve months. During the first quarter of 2018 market volatility returned with an average daily movement of 0.92%, about 42% higher volatility than the long term average daily movement of 0.65%.
This is how our six asset classes performed in the first quarter (January – March) of 2018:
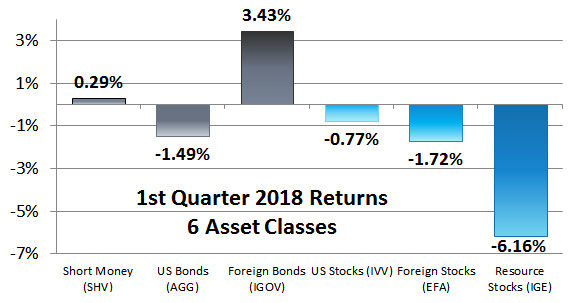
This quarter, we experienced a peak to trough correction of -10.16% which bottomed on February 8. It then rose and fell again on April 2.
In general, stocks were down for the quarter with the S&P 500 down -0.76%, the All Country World Index down -1.18%, U.S. Investable Energy Index down -6.02%, and US REIT Index down -8.39%. Bonds were also down for the quarter with the U.S. Aggregate Bond Index down -1.46%. Foreign bonds experienced variability of returns between down -1.55% with the Emerging Markets Government Index and up +0.98% with the Hedged Global Aggregate Index. Our representative foreign bond fund (symbol: IGOV) is based on the S&P/FTSE International Treasury Bond Index which was up +3.51%.
On average, the stock market moves up or down about 5.78% every quarter. If all that movement was in one direction, the market would move 23.12% every year, but it is not all in one direction. Up and down quarters cancel each other, and only the movement of one and a half quarters each year make up the overall return. While the S&P 500 averages a positive price-only movement of 8.73% each year, it also normally has some three-month period where it is down -13.60%.
That is quarterly volatility. Monthly volatility is even more erratic.
On average every month, the stock market moves up or down about 3.42%. If all that monthly movement was in one direction, the market would move 41.02% every year, but it is not all in one direction. Up and down months are paired and cancel each other out except for less than three months a year which make up the return of the market.
The standard deviation on monthly market movements is 2.94% which means that any weekly movement positive or negative between 0% and 6.36% is within one standard deviation and is quite normal. If you worried every time the market moved more than 6.36% in a month you would be worrying every 8 months or about one and a half times a year.
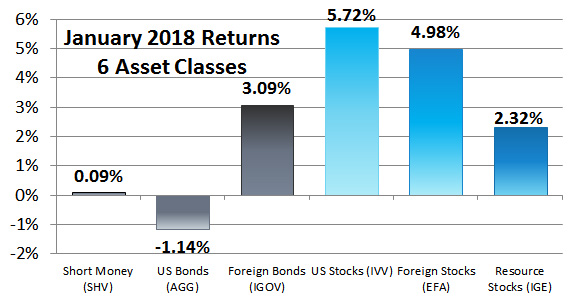
Of course, no one worries when there is upward market volatility like there was in January.
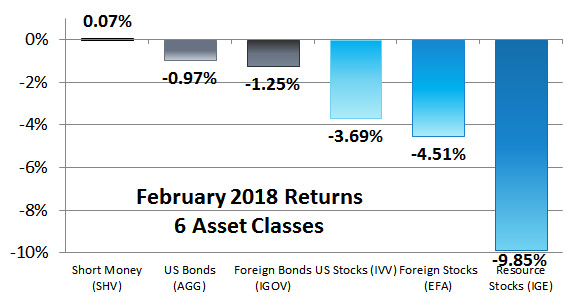
February is often a flat month. From 1929 to 2017 the average U.S. stock market return in the month of February is just 0.02%. This year the return was negative, especially for Resource Stocks. For the U.S. markets represented by the S&P 500 even if you limited worrying to downward market movements worse than -4.79% in a single month, you would still be worrying on average every year.
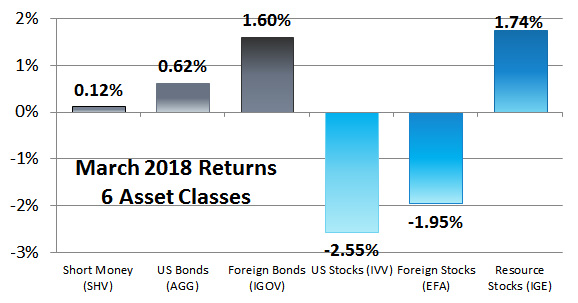
March 2018 Returns were also poor for U.S. and foreign stocks but better for Resource Stocks.
Although volatility is often unwelcome by investors, it can provide profitable returns. The greater the volatility and lower the correlation between assets the greater the rebalancing bonus.
Latest posts from David John Marotta
- #TBT Learning to Live on Your Own - April 18, 2024
- #TBT Frequency Matters More Than Height - April 11, 2024
- Implement a Savings Waterfall for 2024 - April 9, 2024
Latest posts from Austin Fey
- 2024 Tax Facts - November 13, 2023
- #TBT Harvest Major Capital Losses Whenever You Have Them - October 26, 2023
- #TBT Testamentary Donor Advised Funds - August 24, 2023